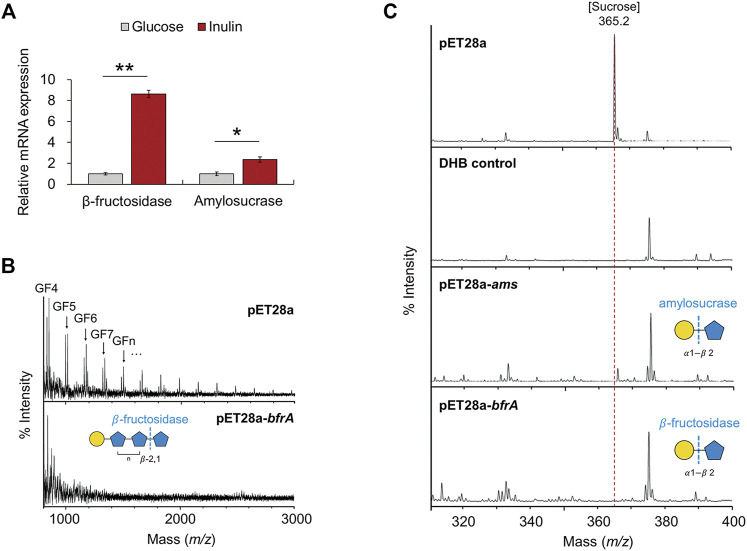
FIGURE 4.
Mass spectrometry analysis of cell lysates. (A) mRNA expression of glycoside hydrolases (β-fructosidase, amylosucrase). The error bars indicate the standard deviation of triplicate samples. *p < 0.05, **p < 0.01. (B) MALDI-TOF-MS spectra of inulin degraded by cell lysates of pET28a-bfrA. Peaks are labeled by DP. G, glucose; F, fructose. All molecular ions are [M + Na]+. (C) MALDI-TOF-MS spectra of sucrose degraded by cell lysates of pET28a-ams, and pET28a-bfrA. All molecular ions are [M + Na]+.

