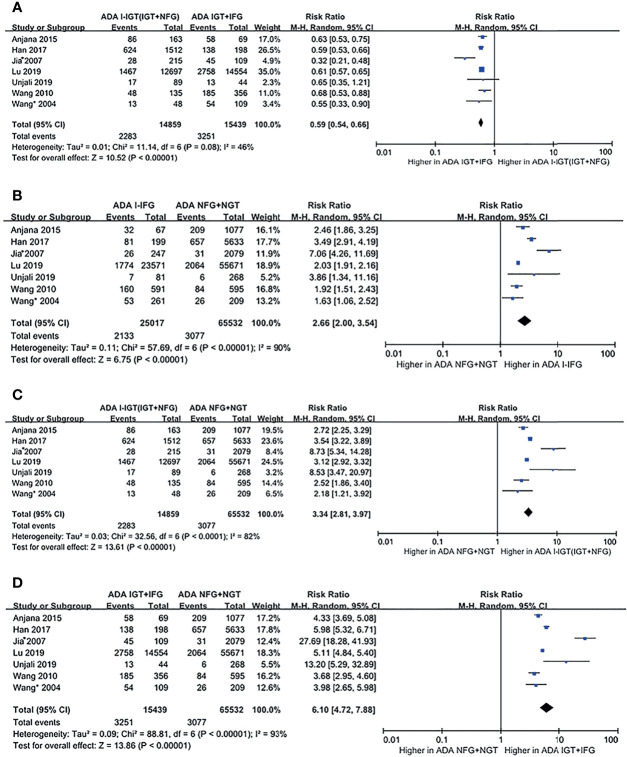
Figure 3.
Forest plots comparing the risk of progression to type 2 diabetes between groups according to the ADA 2003 classification criteria. (A) The risk of progression to type 2 diabetes was higher in the ADA IGT+IFG group than in the ADA I-IGT (IGT+NFG) group. (B) The risk of progression to type 2 diabetes was higher in the ADA I-IFG group than in the ADA NFG+NGT group. (C) The risk of progression to type 2 diabetes was higher in the ADA I-IGT (IGT+NFG) group than in the ADA NFG+NGT group. (D) The risk of progression to type 2 diabetes was higher in the ADA IGT+IFG groups than in the ADA NFG+NGT group. 95% CI, 95% confidence interval; I-IGT, isolated impaired glucose tolerance; IGT+IFG, impaired fasting glucose combined with impaired glucose tolerance; I-IFG, isolated impaired fasting glucose; NFG+NGT, normal fasting glucose combined with normal glucose tolerance.

