
FIGURE 1.
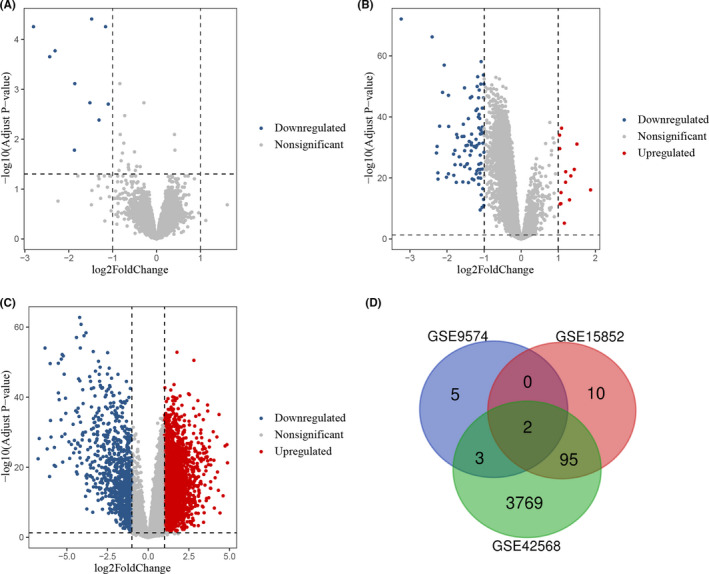
Differentially expressed gene (DEG) identification for each GEO dataset. (A–C) Volcano plots of all genes detected by probes in GSE9574, GSE15852, and GSE42568 datasets, according to the criterion: |log2FC| > 1 and adjusted p < 0.05. The red dots represent upregulated DEGs, the gray dots represent genes without significant difference between groups, and the blue dots represent downregulated DEGs. (D) The Venn diagram of DEGs identified from the three datasets