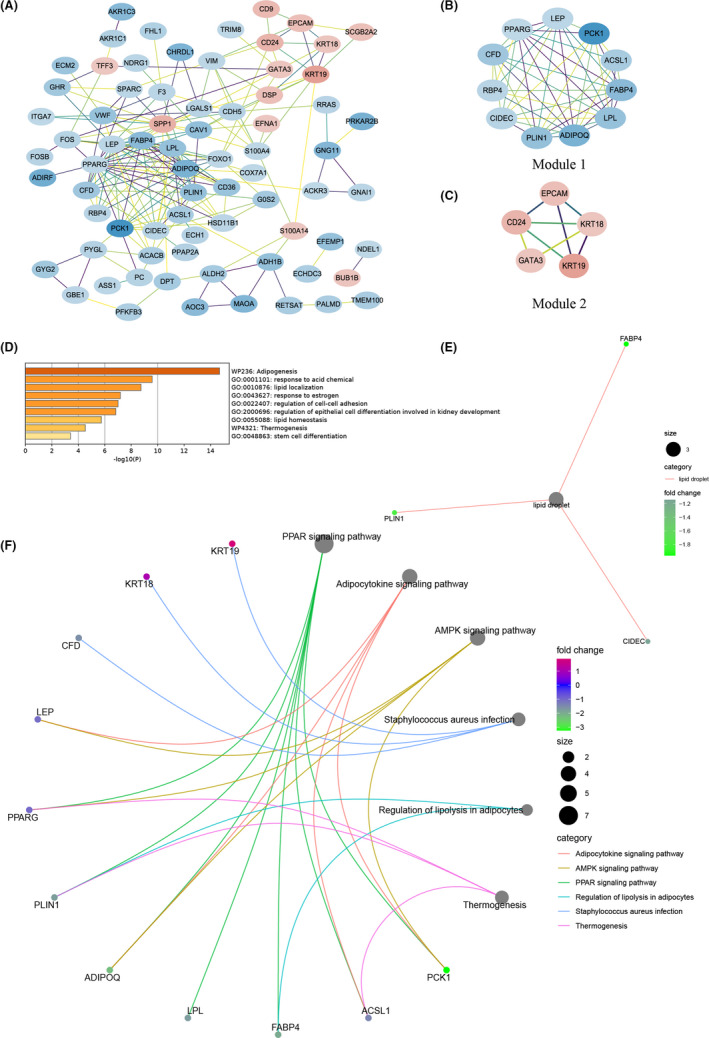
FIGURE 4.

PPI network and module analysis of differentially expressed genes (DEGs) identified from GSE15852 dataset. (A) PPI network constructed by DEGs from GSE15852 dataset. Each node represents a gene. The blue nodes represent the downregulated genes, and the red nodes represent the upregulated genes in BC tissues compared with adjacent‐tumor tissues. The darker the nodes, the more differentially expressed the genes between groups. The degrees between them indicate their interactions. (B, C) Two modules identified from PPI network. (D) Multiple functions and pathways enriched by module genes. (E) Cellular components terms of Gene Ontology enriched by module genes. (F) Kyoto Encyclopedia of Genes and Genomes pathways enriched by module genes
