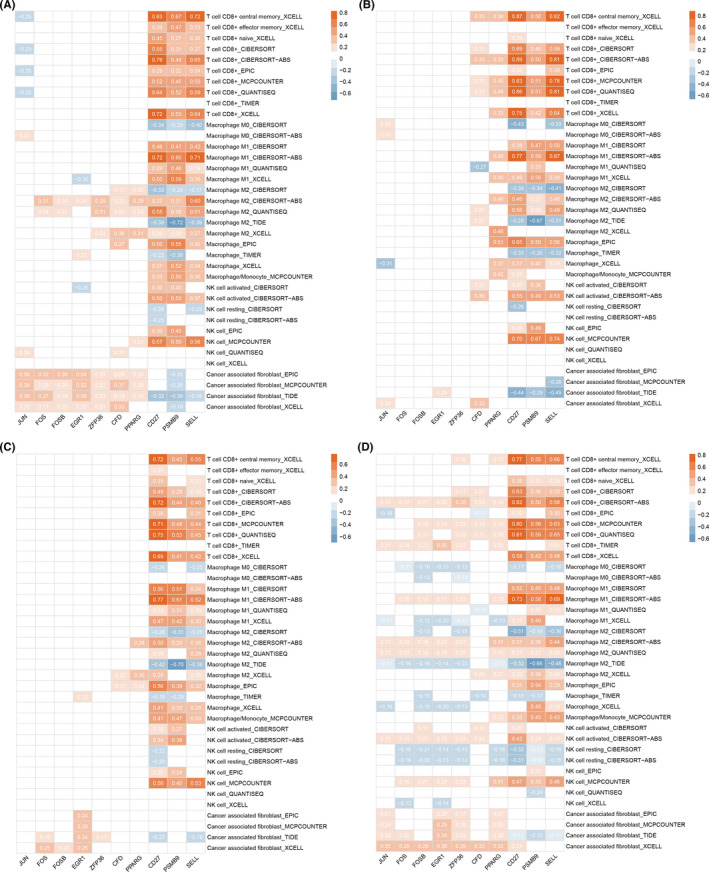
FIGURE 8.

Correlations between candidate gene expression and immune cell infiltration (CD8+ T cell, macrophage, natural killer cell, and cancer‐associated fibroblast) in four major types of breast cancer (BC). (A) In basal BC. (B) In HER2+ BC. (C) In luminal A type of BC. (D) In luminal B type of BC. The color of the rectangle indicates the corresponding degree of correlation. The number in the rectangle represents the corresponding Spearman correlation coefficient and those with p < 0.05 are presented
