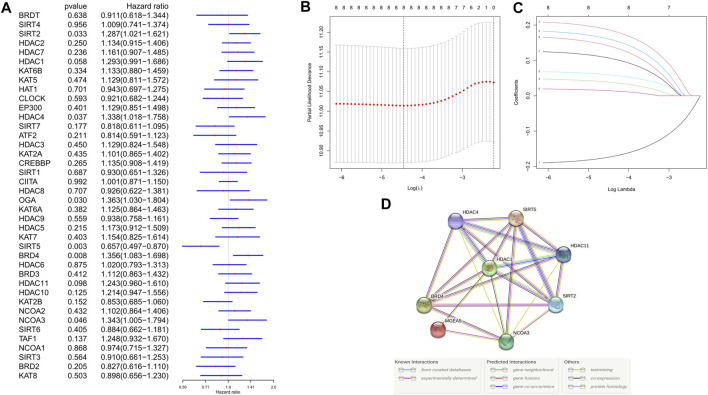
FIGURE 3.
Development of risk signature in the training cohort. (A) Univariate cox regression analysis of OS for each histone acetylation-related regulator, and 8 genes were identified with p < 0.1. (B) Cross-validation for tuning the parameter selection in the LASSO regression. (C) LASSO regression and the coefficients of the 8 OS-related genes. (D) PPI network showing the interactions between the OS-related genes.

