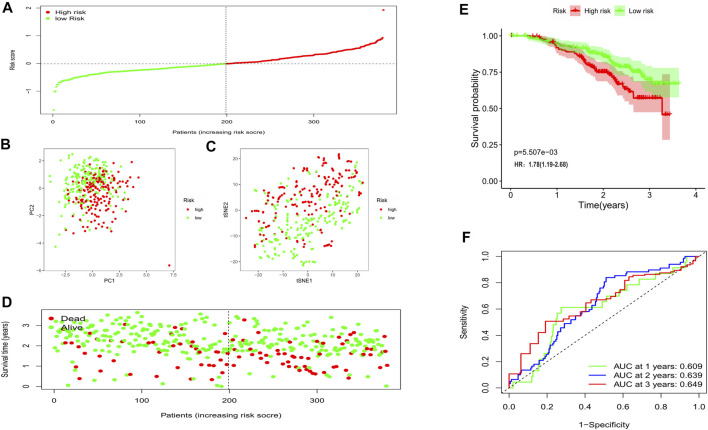
FIGURE 5.
Validation of the risk model in the external cohort. (A) Distribution of patients in the validation cohort based on the median risk score of the training cohort. (B) The PCA plot for OCs. (C) The t-SNE analysis based on the risk score. (D) The survival status for each patient (left of the dotted line: low-risk population; right of the dotted line: high-risk population). (E) Kaplan-Meier curves for the OS. (F) Time-dependent ROC curves for OCs.

