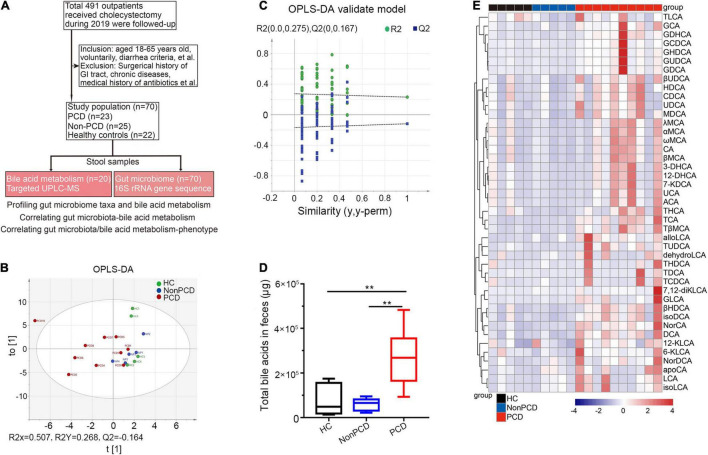
FIGURE 1.
Metabolic changes of fecal bile acids in PCD patients compared to Non-PCD and HC. (A) Flow chart of this study. (B) Orthogonal Projections to Latent Structures Discriminant Analysis (OPLS-DA) plot revealing metabolic deviation of fecal bile acids composition from PCD (n = 10) to Non-PCD (n = 5) patients and HC (n = 5) (R2Y = 0.268, Q2 = -0.164). (C) Representative permutations plot was applied as OPLS-DA validate model among three groups in bile acid metabolism. (D) Box plot presenting excessive total bile acids output in feces from PCD, compared to Non-PCD and HC. Data are shown as Min to Max; n = 5 for Non-PCD and HC, 10 for PCD patients **p < 0.01. (E) Representative heatmap showing quite distinct fecal content of these 43 bile acids detected among three groups; total fecal bile acid excretion of donor was calculated by the concentration (ng/g) × defecation output (g).

