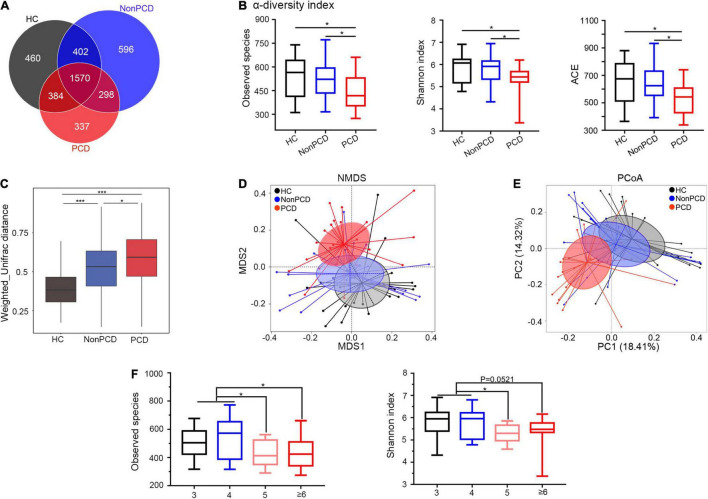
FIGURE 2.
Attenuated alpha diversity and altered gut microbiota composition in patients with PCD. (A) Overlapping Venn diagram showing the operational taxonomic units (OTU) of microbial taxa among these three groups. (B) Decreased alpha-diversity of gut microbiota in the PCD group by observed species, Shannon index and ACE. (C) Box plot for beta-diversity index in three groups based on weighted Unifrac distance (Wilcox rank sum test). (D) The microbial distributions among three groups were indicated by non-metric multidimensional scaling (NMDS) plot with cluster. (E) Differences of bacterial taxa were analyzed by principal coordinate analysis (PCoA) among these groups. (F) Observed species and Shannon index distributed in four classes based on BSS. Data are expressed in box plot as Min to Max; n = 22 for HC, 25 for Non-PCD, and 23 for PCD patients. *p < 0.05 ***p < 0.005. BSS, Bristol stool score.

