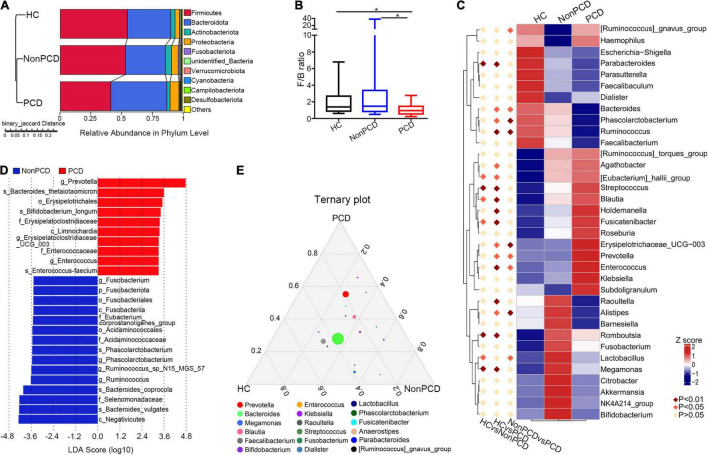
FIGURE 3.
Identification of altered bacterial taxa involved in PCD patients. (A) Grouped unweighted pair-group method with arithmetic means (UPGMA) tree based on binary-Jaccard distance showing microbial similarity among groups (left panel) and relative abundance of top 10 bacteria in phylum level (right panel). (B) Decreased Firmicutes/Bacteroidota ratio in the PCD group, compared to Non-PCD and HC groups. Data are presented in box plot as Min to Max; n = 22 for HC, 25 for Non-PCD, and 23 for PCD patients. *p < 0.05. (C) Representative heatmap analyzed by MetaStat method showing microbial differences in genus level among three groups. (D) Linear discriminant analysis (LDA) effect size (LEfSe) was applied to identify differential abundance of genera in Non-PCD and PCD groups (bacteria whose LDA score > 3.0 were plotted). (E) Ternary plot showing differential microbial genera in these groups; the three vertexes of this graph were denoted HC, Non-PCD, and PCD, respectively. Different dots represent corresponding genera and the size for relative abundance of microbe. The closer to vertexes, the greater contribution to groups.

