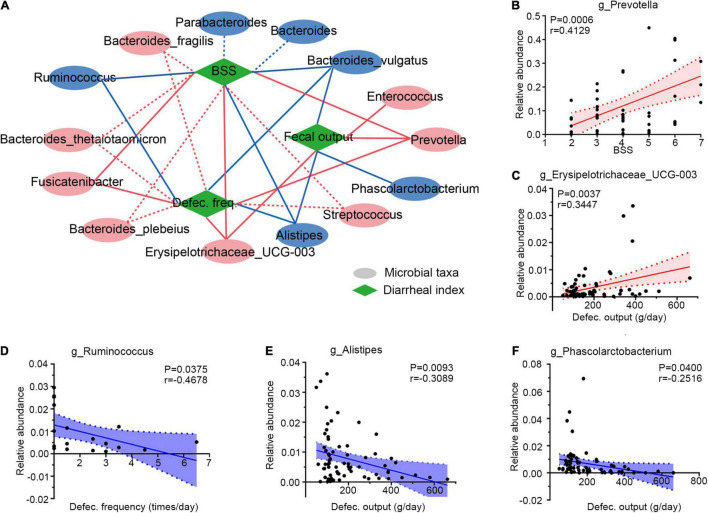
FIGURE 4.
Integrative correlation network of specific and diarrheal phenotype. (A) Correlation network displaying significant associations between altered gut microbes with diarrheal parameters. Microbes and clinical indexes were denoted by circles and rhombus; red color shows an increase (positive related) and blue shows a decrease (negative related) in diarrheal individuals. Any correlations with p > 0.05 and ∣r∣ < 0.25 were abolished; dotted and solid lines were significant and suggestive associations. (B–F) Representatives of special genera-clinical indexes linear correlations. Associations between Prevotella and BSS (B), Erysipelotrichaceae_UCG-003 and defection output (C), Ruminococcus and defection frequency (D), Alistipes and defecation output (E), and Phascolarctobacterium and defecation output (F). Dotted lines show error bar, and areas between two dotted lines denote 95% confidence interval; red indicates positive correlations and blue denotes negative correlations. Single datum point was abandoned once it deviated the correlation line dramatically. BSS, Bristol stool score, defec., defection.

