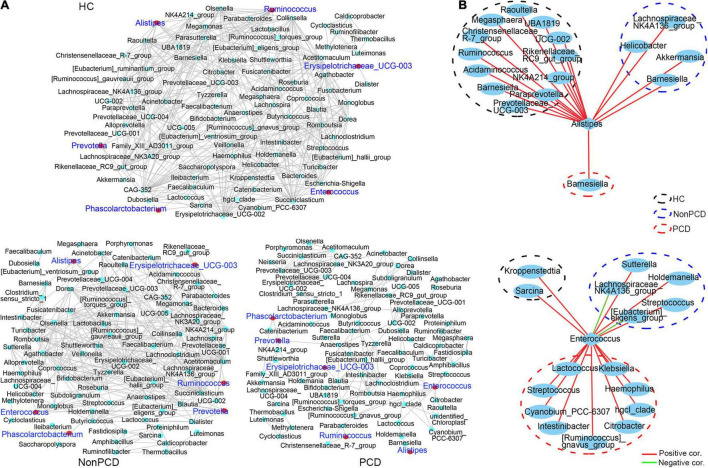
FIGURE 5.
Decreased co-occurrence network among genus bacteria in PCD patients. (A) Representative co-abundance network of genera in three groups, respectively. Based on the database of abundance of each taxon in genus, correlations among top 100 genera were calculated and correlation coefficients (pfdr < 0.05, ∣r∣ > 0.6) were regarded as clear links and visualized by Cytoscape v3.8.2. False discovery rate (FDR) was controlled using the methods of Benjamini, Hochberg, and Yekutieli after the multiplicity testing and adjusted pfdr < 0.05 was considered significant. Green dots represent genus bacteria and the gray line between two dots represents mutual correlation; red dots were labeled blue for 6 key diarrhea-related taxa in three groups. Gut microbiota in HC and Non-PCD groups are closely connected, but tended to assemble to several modules separately in PCD. (B) Reduced co-abundance network of Alistipes (upper panel) and augmented co-abundance network of Enterococcus (lower panel) with other genus microbes in PCD. Blue circles represent bacteria in genus, red lines denote positive correlations, and green lines indicate negative correlations.

