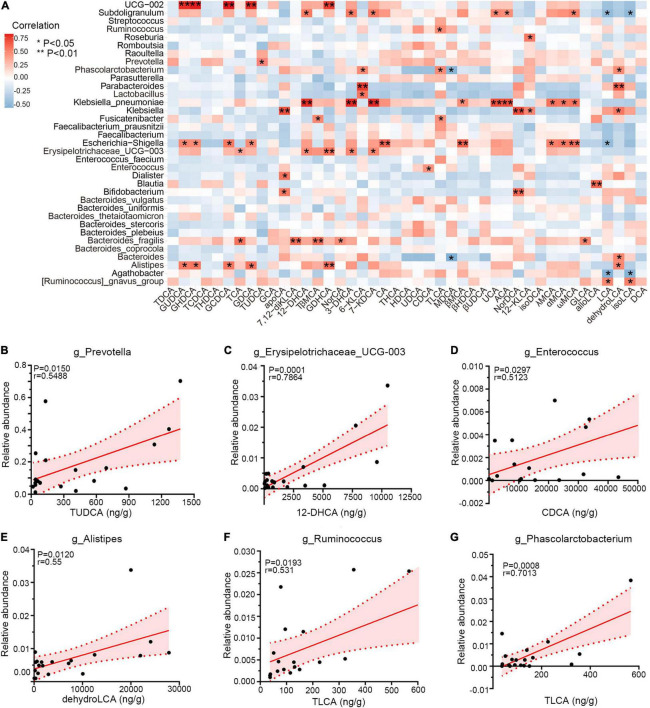
FIGURE 6.
Correlations among gut microbiota and bile acid metabolites. (A) Heatmap of Spearman correlation between relative abundance of gut microbiota and exact concentration of fecal bile metabolites (n = 20), *p < 0.05, **p < 0.01. (B–G) Representative linear correlations of diarrhea-linked genera and bile metabolites. Association between Prevotella and TUDCA (B), Erysipelotrichaceae_UCG-003 and 12-DHCA (C), Enterococcus and CDCA (D), Alistipes and dehydroLCA (E), Ruminococcus and TLCA (F), and Phascolarctobacterium and TLCA (G). Pink dotted lines show error bar and pink area for 95% confidence interval; red denotes positive association. Single datum point was abandoned once it deviated the correlation line dramatically.

