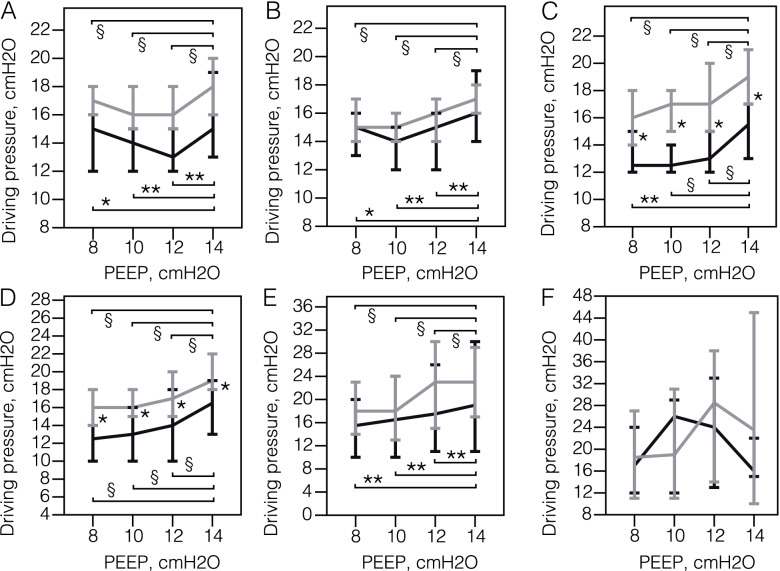
Fig. 2.
The driving pressure at different positive end-expiratory pressure levels (PEEP) («PEEP trial») in survivors and non-survivors during 21 days of the mechanical ventilation. A Day 1. B Day 3. C Day 5. D Day 7. E Day 14. F Day 21. Data on survivors (black) and non-survivors (grey) is presented as medians and 95% confidence in-tervals. The x-axis represents positive end-expiratory pressure levels in cmH2O . * p-value < 0.05, comparison within subgroup of survivors and non-survivors (Friedman test) ; ** p-value < 0.01, comparison within subgroup of survivors and non-survivors (Friedman test) ;§ p-value < 0.001, comparison within subgroup of survivors and non-survivors (Friedman test)

