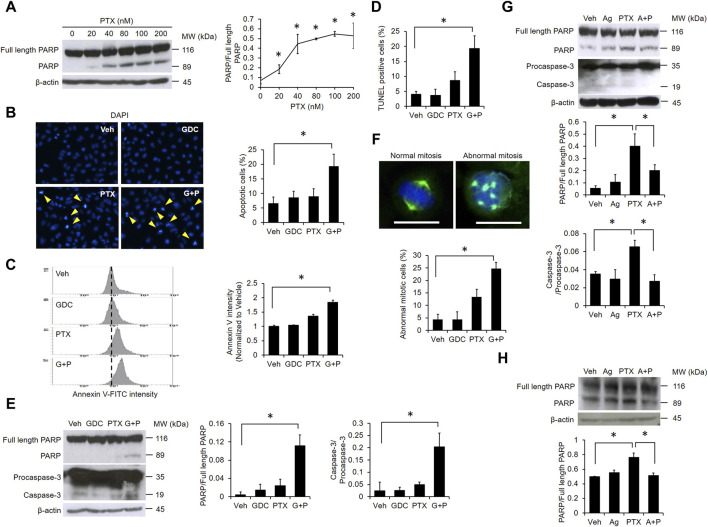
FIGURE 3.
GDC potentiates paclitaxel-induced apoptosis. (A) A549 cells were treated with indicated doses of PTX for 24 h. Whole cell lysates were immunoblotted with anti-PARP and anti-β-actin antibodies. Protein band intensities were analyzed using ImageJ. A549 cells were preincubated with GDC (20 μM) for 1 h followed by PTX (20 nM) treatment for 24 h. Chromosome condensation was observed under fluorescence microscopy (B). Phosphatidylserine exposure was assessed using annexin V-FITC staining by flow cytometry (C). DNA double strand breaks were observed using TUNEL assay analyzed with fluorescence microscopy (D). Activation of PARP and caspase-3 were monitored by western blotting (E). A549 cells were treated as in (B); cell mitosis was observed under fluorescence microscopy. Green color: microtubule; blue color: cell nuclei. Scale bar: 20 μm (F). (G) A549 cells were preincubated with Hh-Ag1.5 (1 nM) for 24 h followed by PTX (20 nM) treatment for 24 h. Total cell lysates were immunoblotted with anti-PARP, anti-caspase-3, and anti-β-actin antibodies. Protein band intensities were analyzed using ImageJ. (H) H1299 cells were preincubated with Hh-Ag1.5 (1 nM) for 24 h followed by PTX (20 nM) treatment for 24 h. Total cell lysates were immunoblotted with anti-PARP and anti-β-actin antibodies. Protein band intensities were analyzed using ImageJ. *: p < .05; indicates a statistically significant difference between indicated groups. All experiments were performed at least three times. n = 3 for all groups.

