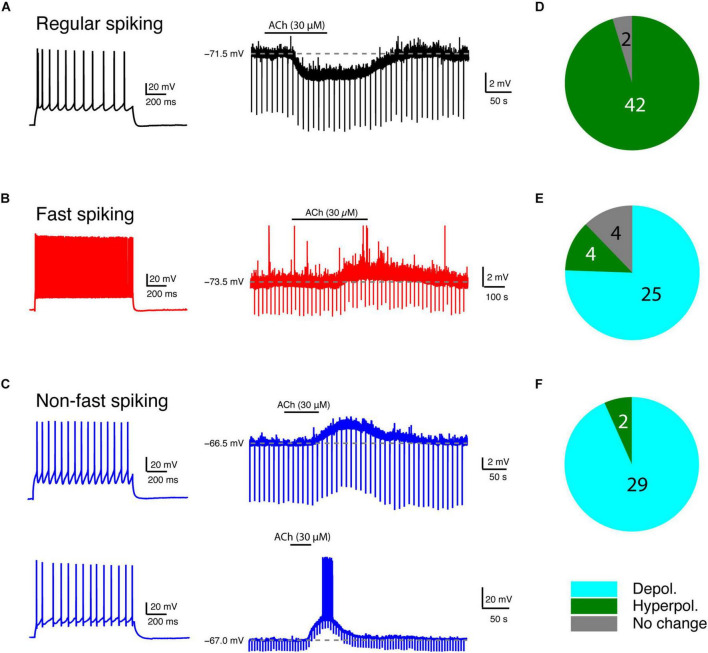
FIGURE 2.
Low concentration of ACh induces diverse Vm changes in L4 RS, FS and nFS neurons. (A) An example recording of the time course of ACh-induced Vm change in a L4 RS neuron. (B) Same as panel (A) but for a L4 FS interneuron. (C) Same as panels (A,B) but for two different L4 nFS interneurons: top, sub-threshold depolarisation; bottom, supra-threshold depolarisation. (D–F) Pie charts summarising the ACh-induced changes in Vm in L4 RS (top), FS (middle), and nFS (bottom) neurons.

