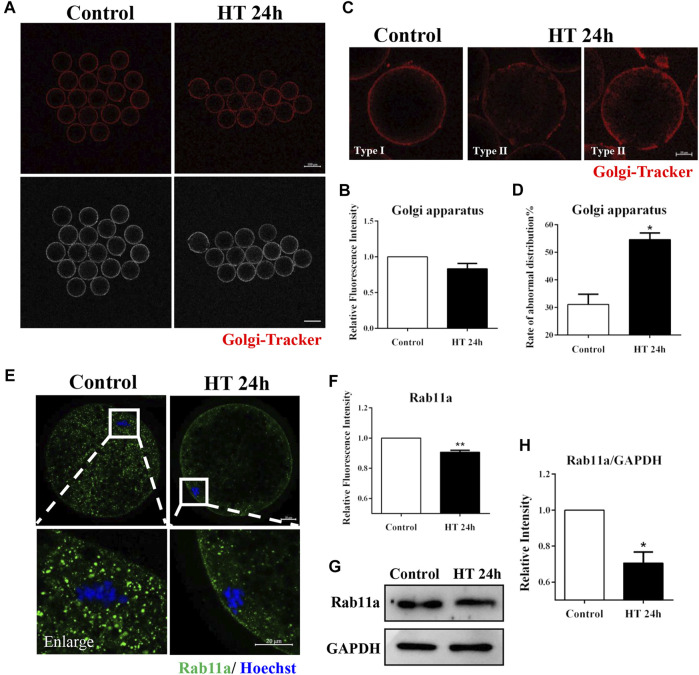
FIGURE 4.
Effect of HT on Golgi apparatus distribution and function in porcine oocytes. (A) Representative images of the Golgi apparatus after HT exposure in porcine oocytes. (B) Relative fluorescence intensity of Golgi-Tracker after HT exposure. Red, Golgi-Tracker. Bar = 100 µm. (C) Representative images of the Golgi apparatus distribution after HT exposure in porcine oocytes. Type Ⅰ, accumulated pattern in proximity to the oolemma; Type Ⅱ, diffused pattern in the cortical area, and does not completely reach the cortex. Abnormal distribution: Type Ⅱ. (D) The rate of abnormal Golgi apparatus distribution after HT exposure. Red, Golgi-Tracker. Bar = 20 µm *, p < 0.05. (E) Representative images of the RAB11a intensity after HT exposure in porcine oocytes. Bar = 100 μm; enlarged bar = 20 µm. (F) Relative fluorescence intensity of RAB11a after HT exposure. Green, RAB11a; Blue, DNA. **, p < 0.01. (G) Western blot result of RAB11a protein expression after HT exposure in porcine oocytes. (H) The band intensity analysis for RAB11a after HT exposure. *, p < 0.05.

