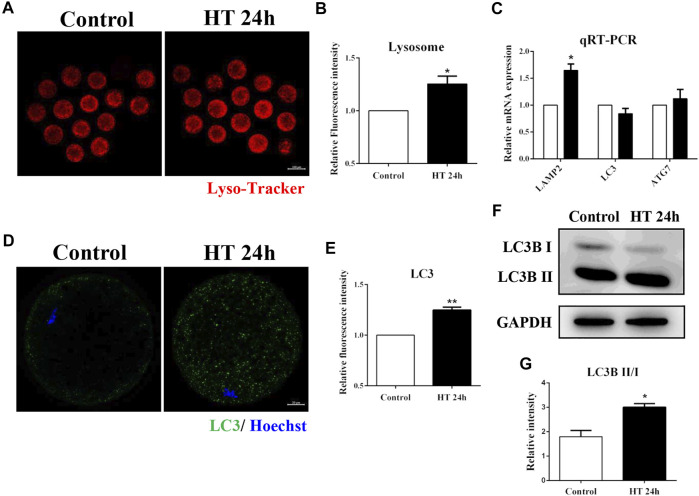
FIGURE 5.
Effect of HT on lysosome function in porcine oocytes. (A) Representative images of lysosomes after HT exposure in porcine oocytes. (B) Relative fluorescence intensity of Lyso-Tracker after HT exposure. Red, Lyso-Tracker. Bar = 100 µm *, p < 0.05. (C) The relative mRNA expression of LAMP2, LC3, and ATG7 in the control and HT-treated group. *, p < 0.05. (D) Representative images of LC3 intensity after HT exposure in porcine oocytes. (E) Relative fluorescence intensity of LC3 after HT exposure. Green, LC3; Blue, DNA. Bar = 20 µm **, p < 0.01. (F) Western blot result of LC3B-Ⅱ/Ⅰ protein expression after HT exposure in porcine oocytes. (G) The band intensity analysis for LC3B-Ⅱ/Ⅰ ratio after HT exposure. *, p < 0.05.

