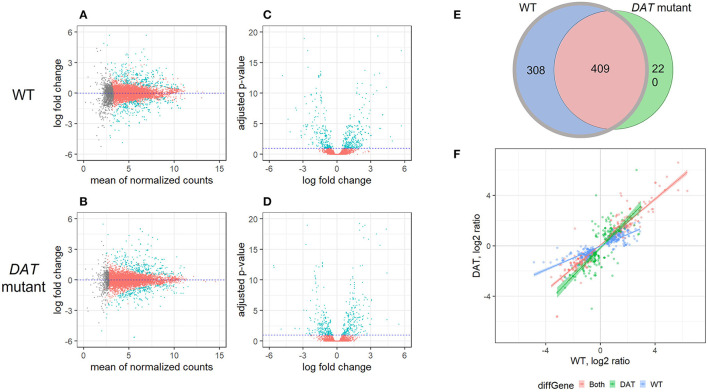
Figure 1.
Differential gene expression in response to AMPH in DAT mutant and isogenic control. (A–D) are gene expression scatterplots for the two strains of flies: WT (w1118 isogenic strain) and DAT mutant. (A,B) are MA plots and (C,D) are volcano plots. In (A–C), differentially expressed transcripts (DE transcripts, those that change their expression in treatment vs. vehicle) are shown in teal; transcripts with changes below the statistical cut-off are in red, while transcripts for which the differential expression status could not be resolved are shown in gray. (E) Overlap between the DE transcript sets between WT (gray circle) and DAT mutant (black circle). At FDR < 0.1, there were 717 DE transcripts in the WT strain and 629 DE transcripts in the DAT mutant flies. The two lists of DE transcripts had 308 genes that were DE only in WT (blue), 220 transcripts that were DE only in DAT (green) and 409 transcripts in common (red). (F) Comparison of the expression level changes between the WT and DAT mutant strains. The 409 DE transcripts shared between the two strains are shown in red; the 220 DAT mutant-specific DE transcripts are shown in green, and the 308 WT-specific DE transcripts are shown in blue.

