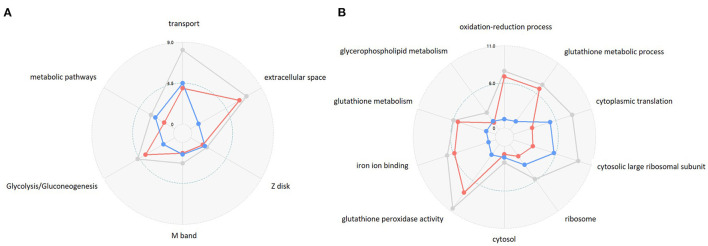
Figure 2.
Comparison of the top GO terms that are enriched in DE genes in the WT strain. GO terms are compared by their p-values; the centers of the circles correspond to –log10(p) = 0, which increases outwards. (A) Downregulated genes; (B) upregulated genes. Gray: all DE genes in WT (these correspond to the 717 DE transcripts in Figure 1E, gray circle); red: DE genes that are shared between WT and DAT mutant (these correspond to the 409 transcripts depicted in red in Figures 1E,F); blue: DE genes that are unique to WT and not shared with DAT mutant (these correspond to the 308 transcripts depicted in blue in Figures 1E,F). The diagrams were created using the R package ggradar (36).

