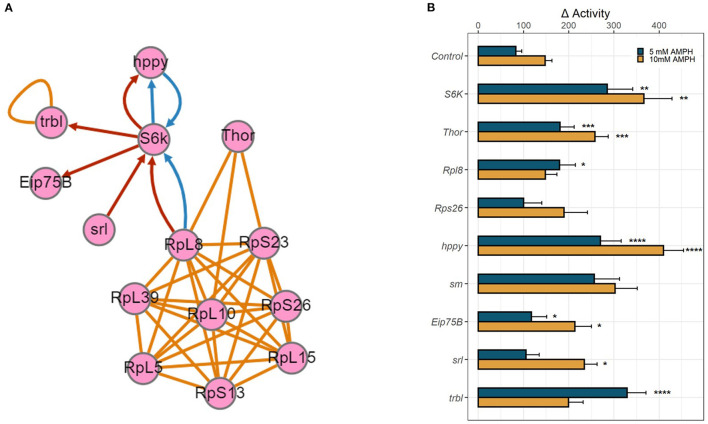
Figure 4.
Functional validation of candidate genes. (A) Gene network depicting physical and genetic interactions between candidate genes identified in RNA-seq and GWA analyses. Orange lines indicate reported physical interaction, blue arrows indicate enhancing genetic interaction, and red arrows indicate suppressing genetic interaction. Network generated using the esyN webtool. S6K and Thor encode direct targets of the MTOR signaling pathway, S6 Kinase and 4E-BP, which are known to interact with ribosomal proteins to modulate mRNA translation. hppy encodes MAP4K3 which regulates the phosphorylation of S6K and 4E-BP. Eip75B, srl, and trbl all encode modulators of insulin-mTOR S6K signaling. (B) RNAi-mediated knockdown of candidate genes was targeted to dopamine neurons using TH-GAL4. Bar graphs depict change in activity in response to 5 mM AMPH (blue) or 10 mM AMPH (yellow). Error bars indicate SEM. Statistical significance was determined by Kruskal-Wallis ANOVA (p < 2e-16). Asterisks indicate pairwise significance compared to genotype control after AMPH treatment, as determined by post-hoc Dunn's Test with a Benjamini-Hochberg correction for multiple testing, ****p.adj < 0.0001, ***p.adj < 0.001, **p.adj < 0.01, *p.adj < 0.05.

