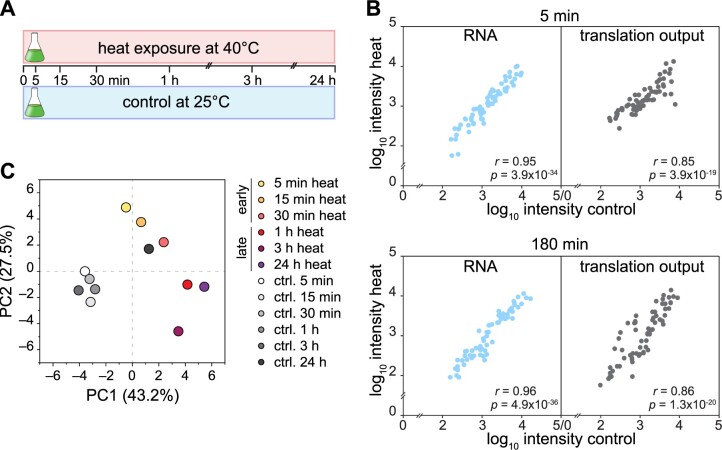
Figure 2.
Metagene view of chloroplast mRNA changes and translation profile during heat acclimation. A, Schematic diagram of the experimental setup: Cells were exposed to heat at 40°C and harvested at the indicated time points. Control cultures were treated at room temperature (25°C). B, Scatterplot comparing the translation output and total RNA accumulation between control and 5- or 180-min heat exposure. The average ribosome footprint (translation output) and transcript (RNA) abundances were calculated for each RF and plotted on a Log10 scale; x- and y-axes are broken for better visualization. Pearson’s correlation coefficients and ANOVA’s P-values (stating the significance of the regression) are given in the plot. C, PCA of translation output of heat-treated and control samples. A PCA plot representing all individual replicates is shown in Supplemental Figure S3.

