Figure 7.
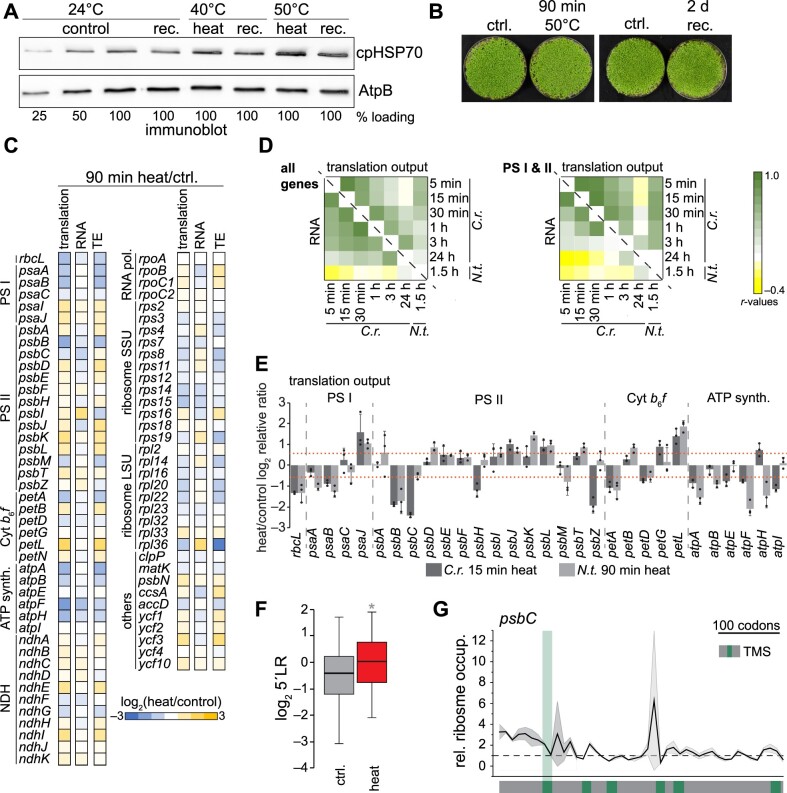
Heat-induced changes of chloroplast translation are widely conserved between a green alga and a vascular plant. Heat-induced changes of chloroplast RNA accumulation and translation output in tobacco (N. tabacum). A, Immunoblot analysis of heat-treated tobacco samples exposed for 90 min to 40°C or 50°C, allowed to recover for 2 days at 24°C (rec.), or remained untreated (control). Reversible heat induction of the cellular stress response is demonstrated by probing against chloroplast HSP70; AtpB serves as loading control. B, Images of tobacco seedlings exposed to heat at 50°C for 90 min. For recovery (rec.), plants were returned to 24°C for 2 days. Control plants (ctrl.) remained untreated. C, Heatmap representation of the relative values of translation output, transcript accumulation data (RNA) and TE. All values are the mean of three independent biological replicates and are plotted on a Log2 scale and colored as indicated in the legend at the bottom. Each row represents one gene. Respective column plots with indicated significant changes are shown in Supplemental Figure S11. D, Heatmap of Pearson’s correlation coefficients comparing heat-induced changes of translation output (above diagonal line) and RNA accumulation (below diagonal line) between Chlamydomonas heat kinetics and tobacco data. Comparison was performed for all chloroplast genes, or genes of photosystems I and II (PSI and II). E, Column plot comparing the heat-induced changes of translation output of photosynthetic genes between Chlamydomonas and tobacco. Dashed lines indicate changes >1.5-fold. All values are the mean of three independently grown replicates ± standard deviation; individual data points are shown as black circles. F, Changes of 5′LR between heat and control data of translation output. Asterisk indicates two-sided, paired t-test P-values < 0.05. G, Ratio plot for psbC of relative ribosome occupancy between heat-treated and control samples. The ribosome footprint intensity was calculated as the fraction of probe signal to the summed signal for each condition. The dashed line indicates the value with no change between heat and control samples. Standard deviations are plotted as ribbons, calculated from three independent biological replicates. Positions of the TMSs were extracted from https://www.uniprot.org and are marked in green, with the first TMS extended. Additional transcripts are shown in Supplemental Figure S13.

