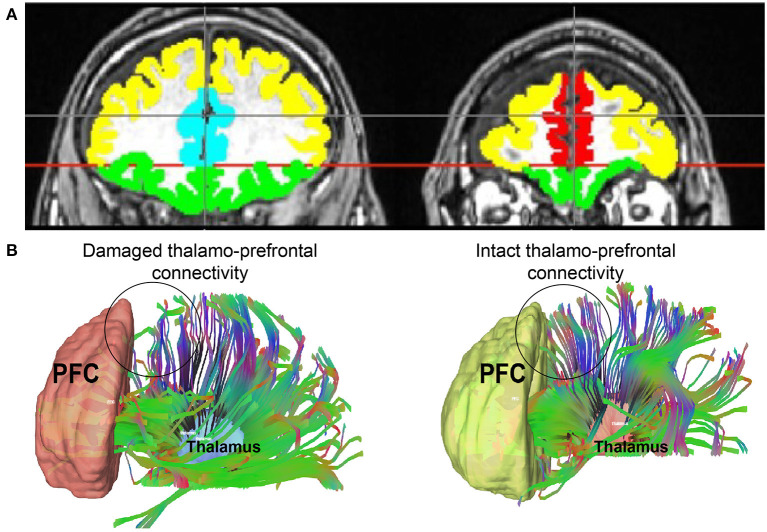
Figure 1.
(A) An example of PFC regions of interest with colors representing each one. Yellow = dlPFC; green = OFC; teal = ACC; red = mPFC. (B) Thalamo-prefrontal tractography from two representative patients: one with damage to thalamo-prefrontal projections and one without. An area of decreased thalamo-prefrontal projections in the patient with damage to these connections is represented by a circle. This same area in the patient with intact projections is circled as well. dlPFC, dorsolateral prefrontal cortex; ACC, anterior cingulate cortex; mPFC, medial prefrontal cortex; OFC, orbitofrontal cortex.

