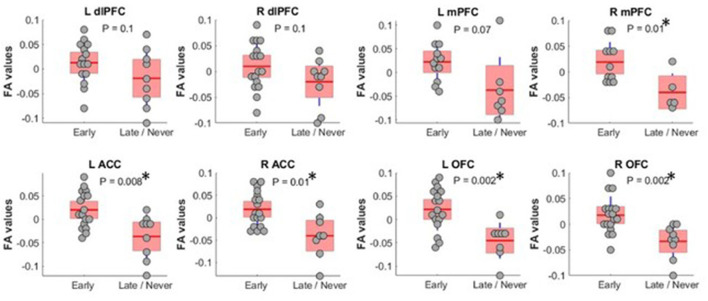
Figure 3.
FA values (showing residual after adjusting for age and sex) between MD thalamus and PFC subregions. Subregions with significantly different FA between Early and Late/Never command-following groups are shown with an asterisk. A two-sample t-test was used to test residual of FA values after adjusting for age and sex using linear regression. L OFC and R OFC survived a Bonferroni correction. dlPFC, dorsolateral prefrontal cortex; ACC, anterior cingulate cortex; mPFC, medial prefrontal cortex; OFC, orbitofrontal cortex; FA, fractional anisotropy; MD, mediodorsal thalamic nucleus.

