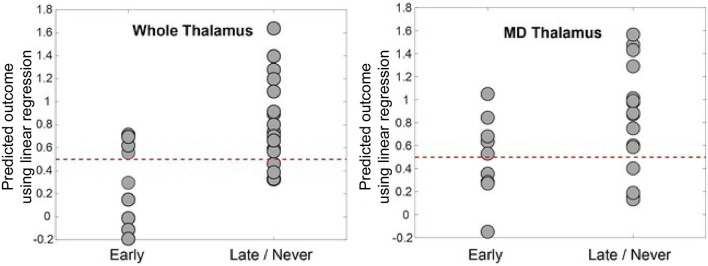
Figure 4.
Predicted outcome by linear regression model vs. actual outcome. This was generated by leave-one-out cross-validation using log-transformed FA values between prefrontal regions and the whole thalamus (left panel) and MD (right panel). The dotted line at 0.5 represents the intuitive threshold used in this work to separate two different outcomes (represented by 0 and 1 in the regression). The prediction accuracy is 72% for the whole thalamus and 64% for MD. The model for whole thalamus selected left and right dlPFC, right mPFC, and right ACC as predictive variables. The model for MD selected left and right ACC, mPFC, OFC, and left dlPFC regions, as well as male sex as predictive variables. dlPFC, dorsolateral prefrontal cortex; ACC, anterior cingulate cortex; mPFC, medial prefrontal cortex; OFC, orbitofrontal cortex; FA, fractional anisotropy; MD, mediodorsal thalamic nucleus.

