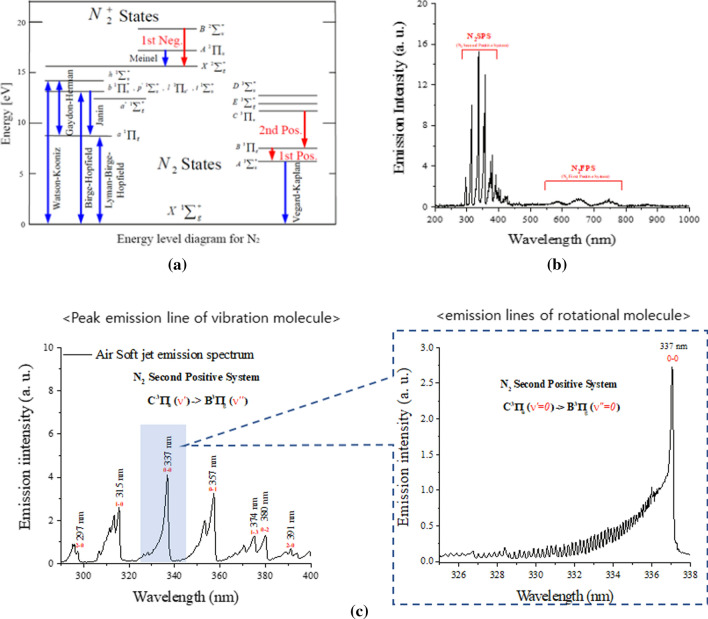
Fig. 10.
a Transitional energy diagram N2 SPS (C3IIu → N2 B3IIg) and N2 FPS (N2+ B2Σu + → N2+ X2Σg+). b Optical emission spectra of the N2 SPS and the N2 FPS. c Vibrational spectra of the N2 SPS and magnified rotational spectrum in the 0–0 vibrational band around 337 nm of C3IIu (v = 0) → B3IIg (v = 0), as in the dotted box (c) [105]

