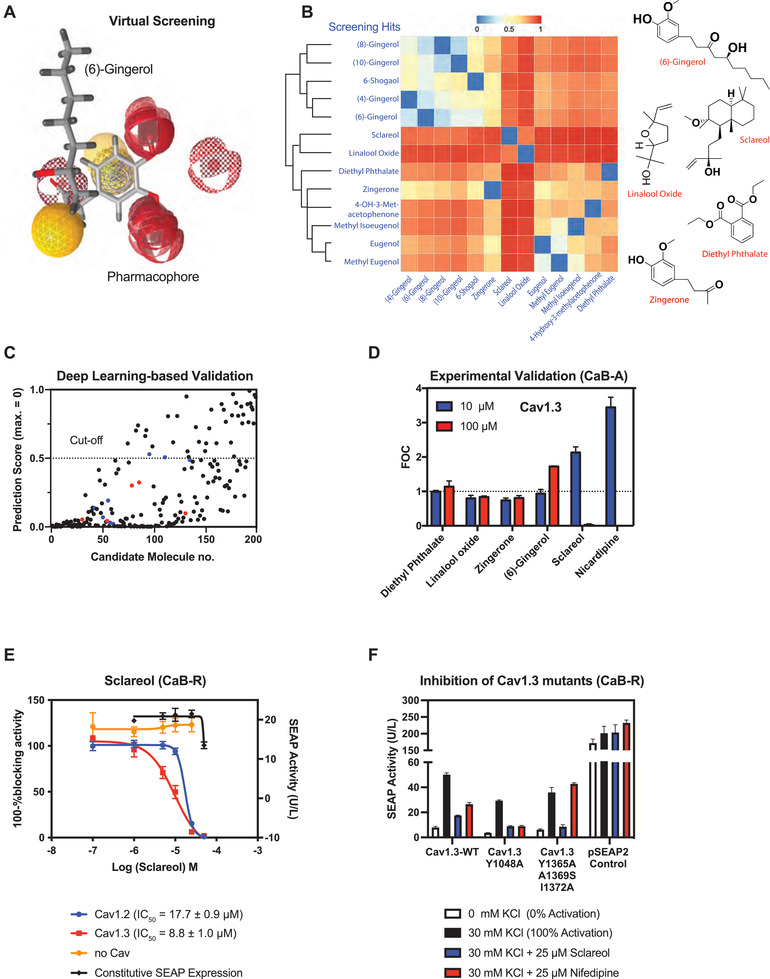
Figure 3.

Identification of active constituents that selectively inhibit CaV1.3. A) Ligand‐based virtual screening. Representative merged pharmacophore models for CaV1.3 inhibitors created with LigandScout using the positive and negative reference compounds listed in Table S3, Supporting Information. This illustration exemplifies the alignment of (6)‐gingerol to the CaV1.3‐blocking pharmacophores. B) Structure clustering analysis of candidate compounds. All 13 hits from the virtual screening experiment using 198 candidate molecules derived from GC‐MS data of essential oils (Table S3, Supporting Information) were clustered based on structure similarity using the ChemMine tool. Right panel: chemical structures of the five compounds selected as representatives of the clusters. C) Validation of virtual screening using a trained deep‐learning neural network. A D‐MPNN described in[ 40 ] was trained with reported CCBs (Table S6, Supporting Information) as well as randomly chosen compounds from MUV datasets (47) in order to validate the 198 candidate molecules screened by LigandScout. Virtual screening hits in (B) are highlighted in blue (before clustering) and red (after clustering). Numerical values of rank‐ordered prediction scores (y‐axis) are listed in Table S5, Supporting Information. An arbitrary cut‐off of 0.5 was chosen to assess general goodness. D) Assessment of putative CaV1.3 antagonism by the PD drug candidates. HEK‐293 cells transfected with the CaV1.3‐dependent CaB‐A system were depolarized with 30 mm KCl and immediately seeded into culture wells containing different drug candidates supplemented at 10 or 100 µm. Data points are presented as mean FOC (fold of DMSO control) of SEAP levels scored at 48 h after exposure to nicardipine (n = 3 independent experiments). E) Quantification of CaV1 antagonism by sclareol using CaB‐R. HEK‐293 cells transfected with CaV1.2‐ or CaV1.3‐dependent CaB‐R were depolarized with 30 mm KCl and immediately seeded into culture wells containing different concentrations of sclareol. HEK‐293 cells transfected with a constitutive SEAP‐expression vector (pSEAP2‐Control; PSV40‐SEAP‐pA) were used as a reference for putative cytotoxicity caused by drug exposure. HEK‐293 cells transfected with a bacterial expression vector (pViM41; PT7‐mCherry‐MCS) were used as a negative control indicating CaV‐unrelated assay readouts. Data are mean ± SD of SEAP levels scored at 48 h after drug exposure (n = 3 independent experiments). F) Quantification of CaV1 antagonism by sclareol and nifedipine on different CaV1.3 mutants. HEK‐293 cells transfected with CaB‐R regulated by different synthetic CaV1.3 mutants (WT, pCaV1.3/pKK56/pMX57; CaV1.3Y1048A, pWH154/pKK56/pMX57; CaV1.3Y1365A, A1369S, I1372A, pWH155/pKK56/pMX57) were depolarized with 30 mm KCl and immediately seeded into culture wells containing different concentrations of sclareol or nifedipine. HEK‐293 cells transfected with a constitutive SEAP‐expression vector (pSEAP2‐Control; PSV40‐SEAP‐pA) were used as a reference for putative cytotoxicity caused by drug exposure. Data are mean ± SD of SEAP levels scored at 48 h after drug exposure (n = 3 independent experiments).
