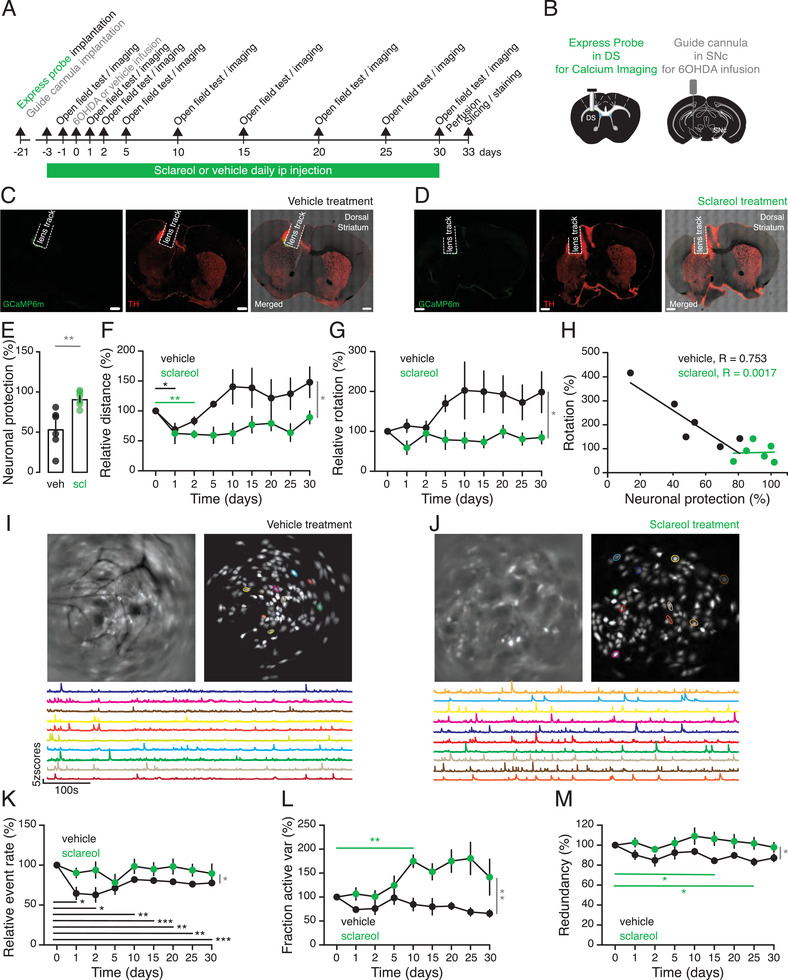
Figure 4.

Sclareol exhibits in vivo neuroprotective effects against 6‐OHDA‐induced degeneration. A) Experimental set‐up for simultaneous monitoring of locomotion behavior and live neuronal dynamics imaging in 6‐OHDA‐infused PD mice treated with daily doses of either sclareol (55 mg kg−1) or vehicle as a negative pharmacologic control. B) Schematic illustration of the surgical placement of the express probe and the miniature microscope above the DS for live imaging of calcium dynamics of striatal neurons as well as the guide cannula above the ipsiversive SNc to infuse the PD‐triggering neurotoxin 6‐OHDA. C,D) Representative confocal micrographs of a DS section of a vehicle‐treated control (C) and sclareol‐treated (D) animal showing the track left behind the lens and expression of GCaMp6m immediately below. The tissue was stained for DA neuron‐specific marker TH (red). E) Sclareol‐mediated neuronal protection level quantified by differential TH staining with the contraversive hemispheres in sclareol and vehicle treatment groups. F) Relative distance traveled over time by the sclareol and vehicle treatment groups. G) Relative contraversive rotations performed by both mouse groups at each time point of the experiments. H) Correlation between the relative number of contraversive rotations and the neuronal protection levels of sclareol and vehicle treatment groups. I,J) Representative raw live calcium imaging and profiling of individual cells (circled in different colors) and the corresponding dynamic calcium time courses (matching colors) recorded from vehicle‐treated (I) and sclareol‐treated (J) animals using the head‐mounted miniaturized microscope. K) Relative calcium transients event rates for sclareol and vehicle treatment groups. L) Relative variance of the active neuronal fraction over time for sclareol and vehicle treatment groups. M) Relative neuronal redundancy time course for sclareol and vehicle treatment groups. Data are relative to the values obtained on day 0 before the infusion of 6‐OHDA (n = 6; scale bar 500 µm). Data are shown as the mean ± SEM, statistics by unpaired t‐test (E) or two‐way repeated‐measures ANOVA test (F, G, K–M), n = 6 mice per group. *p<0.05, **p<0.01, ***p<0.001, stats shown in black and green relate to vehicle‐ and sclareol‐ treated mice respectively, whereas stats shown in grey relate to the comparison between both groups.
