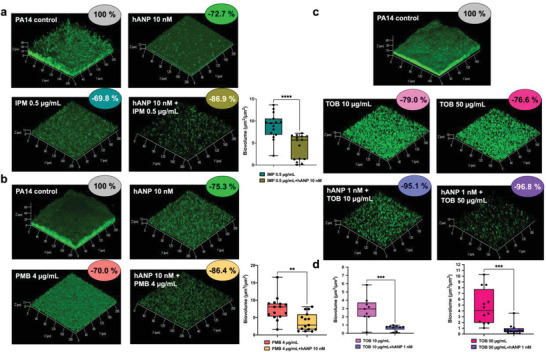
Figure 3.

Synergistic effect of hANP in combination with antibiotics on established biofilm of P. aeruginosa. a) 3D shadow representations of 24 h old P. aeruginosa PA14 biofilm structures untreated (control condition) or treated with hANP (10 × 10−9 m), imipenem (IPM) (0.5 µg mL−1), or the combination of IPM (0.5 µg mL−1) and hANP (10 × 10−9 m). COMSTAT image analyses of 24 h old biofilm structures of P. aeruginosa PA14 exposed to IPM (0.5 µg mL−1) or a combination of IMP (0.5 µg mL−1) and hANP (10 × 10−9 m). Data are the result of the analysis of 15 views from five independent biological experiments (n = 5). Statistics were achieved by a two‐tailed t test. Asterisks indicate values that are significantly different as follows: ****, p < 0.0001. b) 3D shadow representations of 24 h old P. aeruginosa PA14 biofilm structures untreated (control condition) or treated with hANP (10 × 10−9 m), polymyxin B (PMB) (4 µg mL−1), or the combination of PMB (4 µg mL−1) and hANP (10 × 10−9 m). COMSTAT image analyses of 24 h old biofilm structures of P. aeruginosa PA14 exposed to PMB (4 µg mL−1) or a combination of PMB (4 µg mL−1) and hANP (10 × 10−9 m). Data are the result of the analysis of 15 views from five independent biological experiments (n = 5). Statistics were achieved by a two‐tailed t test. Asterisks indicate values that are significantly different as follows: **, p < 0.01. c) 3D shadow representations of 24 h preformed P. aeruginosa PA14 biofilm structures in control condition (untreated) or exposed to tobramycin (TOB) at 10 or 50 µg mL−1, or to a combination of TOB (at 10 or 50 µg mL−1) and hANP (1 × 10⁻⁹ m) for 2 h at 37 °C. d) COMSTAT image analyses of 24 h old biofilm structures of P. aeruginosa PA14 exposed to tobramycin at 10 µg mL−1 or a combination of tobramycin (10 µg mL−1) and hANP (1 × 10⁻⁹ m) (left panel) and 50 µg mL−1 or a combination of tobramycin (50 µg mL−1) and hANP (1 × 10⁻⁹ m) (right panel), for 2 h at 37 °C. Data are the result of the analysis of nine views from three independent biological experiments (n = 3) for TOB at 10 µg mL−1 and 12 views from four independent biological experiments (n = 4) for TOB at 50 µg mL−1. Statistics were achieved by a two‐tailed t test. Asterisks indicate values that are significantly different as follows: ***, p < 0.001.
