Figure 4.

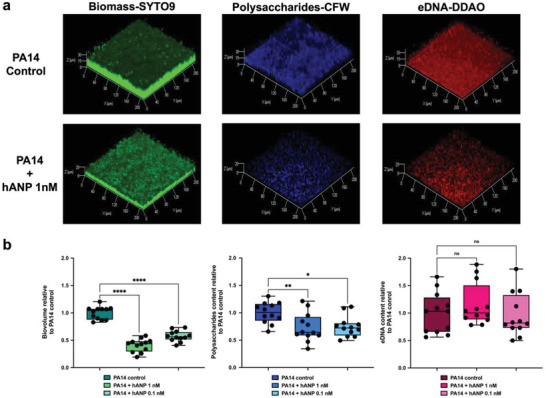
Impact of hANP on P. aeruginosa matrix composition. a) 3D shadow representations of the 24 h preformed P. aeruginosa PA14 biofilm structures, polysaccharides, and eDNA matrix components, exposed to hANP (1 × 10⁻⁹ or 0.1 × 10⁻⁹ m) for 2 h compared to control condition. Bacterial cells within biofilms were stained in green using SYTO9 (left panel). β1‐3 and β1‐4 polysaccharides were stained in blue using CalcoFluor White (CFW) (central panel). eDNA was stained in red using DDAO (right panel). Image acquisition was performed using CLSM. b) COMSTAT image analyses of bacterial biovolume (left panel), β1‐3 and β1‐4 polysaccharides (central panel) or eDNA (right panel) matrix components of P. aeruginosa PA14 biofilms structures unexposed (control condition) or exposed to hANP (1 × 10⁻⁹ or 0.1 × 10⁻⁹ m) for 2 h at 37 °C. Polysaccharides and eDNA values are normalized to biofilm biomass. Data are the result of the analysis of 12 views from four independent biological experiments (n = 4). Statistics were achieved by ordinary one‐way ANOVA followed by Dunnett's multiple‐comparison test. Asterisks indicate values that are significantly different as follows: *, p < 0.05, **, p < 0.01; ****, p < 0.0001.
