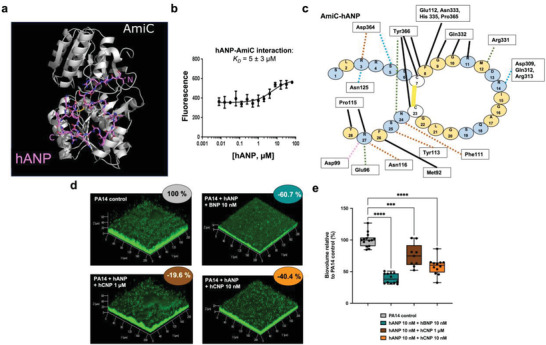
Figure 5.

hANP and P. aeruginosa AmiC protein binding. a) Docking of hANP to AmiC. Shown is the best pose of hANP docking to the AmiC monomer determined by the FRODOCK server. The peptide binds across the surface where AmiC binds to AmiR. AmiC is shown in the cartoon representation, and hANP is shown in sticks. Colors: AmiC, white; hANP carbon, pink; oxygen, red; nitrogen, blue; sulfur, yellow. Image generated using the PyMOL Molecular Graphics System v2.4.1, Schrödinger, LLC. b) Direct hANP affinity for purified AmiC using MicroScale Thermophoresis. Recombinant AmiC was fluorescently labeled and incubated with varying concentrations of hANP. Data are the mean of three independent experiments. c) Schematic of the AmiC‐hANP interaction. Interactions were determined using LigPlot+ (Figure S4, Supporting Information) and checked manually using PyMOL. The hANP peptide is shown as individual amino acids in circles. AmiC residues interacting with hANP are shown in rectangles. Interactions are colored by type: hydrophobic interactions, black solid line. Disulfide bond, yellow solid line. Hydrogen bond to side chain, orange dashed line. Hydrogen bond to main chain, green dashed line. Salt bridge, pink dashed line. Assigned as hydrophobic by LigPlot but likely hydrogen bonds, blue dashed line. d) 3D shadow representations of the 24 h preformed P. aeruginosa PA14 biofilm structures exposed for 2 h at 37 °C to hANP and hBNP (10 × 10−9 m each) or to hANP (10 × 10−9 m) and hCNP at 1 × 10⁻⁶ m or 10 × 10−9 m compared to control condition (PA14 control; untreated). e) COMSTAT image analyses of biofilms structures of P. aeruginosa PA14 control or exposed for 2 h to hANP and hBNP cocktail (10 × 10−9 m each) or to hANP (10 × 10−9 m) and hCNP at 1 × 10⁻⁶ or 10 × 10−9 m. Data are the result of the analysis of at least nine views from at least three independent biological experiments (n = 3). All biofilms were stained with SYTO9 and observed by CLSM. Statistics were achieved by ordinary one‐way ANOVA followed by Dunnett's multiple‐comparison test. Asterisks indicate values that are significantly different as follows: ***, p < 0.001; ****, p < 0.0001.
