
Figure 2.
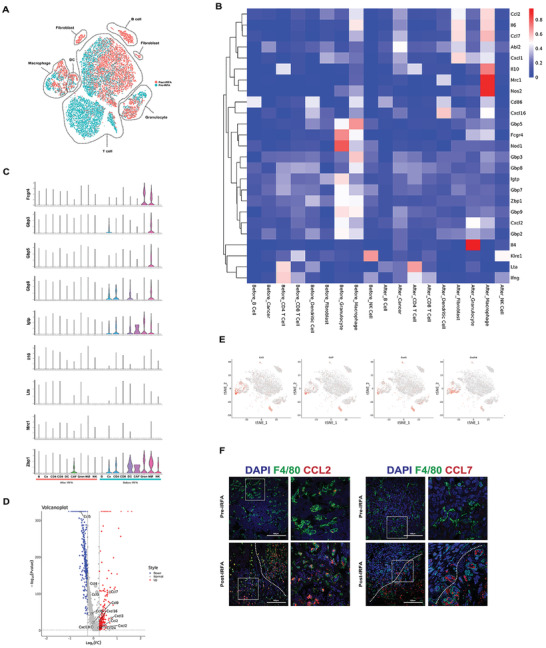
Macrophages after IRFA represent the immunosuppression phenotype. A) T‐SNE plot using scRNA‐seq data from cells sorted from normal tumors and tumors 7 days after IRFA. Cells from normal tumors served as the control. Control and IRFA samples were pooled. B) Expression in different clusters of immune response mRNA in tumors from tumor cells before and after IRFA. C) Violin plots showing the gene expression probability distribution of immune response. D) Volcano plot showing differential expression of chemokines between two lines (after / before IRFA). Genes with statistically significant differential expression (≥1.2‐fold, p < 0.05) located in the top right and left quadrants. E) Feature plot of CCL2, CCL7 expression across cell clusters after IRFA identified in Figure 2A. F) Fluorescence microscopy images illustrating CCL2, CCL7 (red) expression with DAPI nuclear (blue) and F4/80 (green) counterstain in residual tumors. Scale Bar = 100 µm.