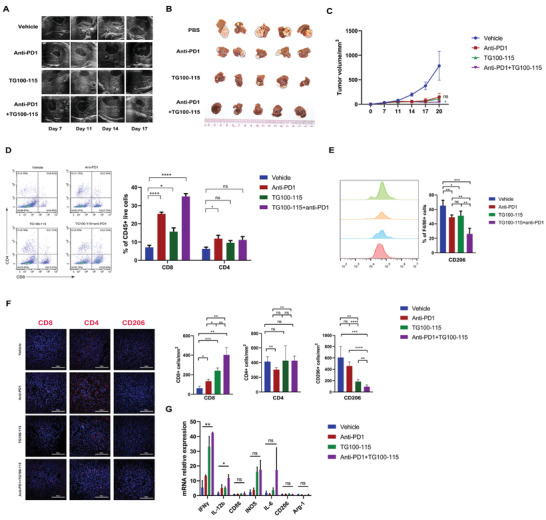
Figure 6.

The combination of TG100‐115 and anti‐PD‐1 inhibits tumor progression in residual orthotopic tumors. A) Representative ultrasound images of tumors on day 7, 11, 14, and 17. B) Representative image of the residual orthotopic tumors. C) Growth curve of the residual tumors. D) Representative flow cytometric analysis and quantification of CD8+ and CD4+ T cell populations. E) Representative flow cytometric analysis and quantification of CD206+ cell populations. F) Representative IF and quantification of CD4, CD8, and CD206 in mice tumor sections in different groups. (B–F) n = 5, ns > 0.05, *p < 0.05, **p < 0.01, ***p < 0.001, ****p < 0.0001 by one‐way ANOVA. Scale Bar = 100 µm. G) Fold change mRNA expression in tumor tissues in the 4 groups (n = 3, ns > 0.05, *p < 0.05, **p < 0.01, by one‐way ANOVA).
