
FIGURE 1.
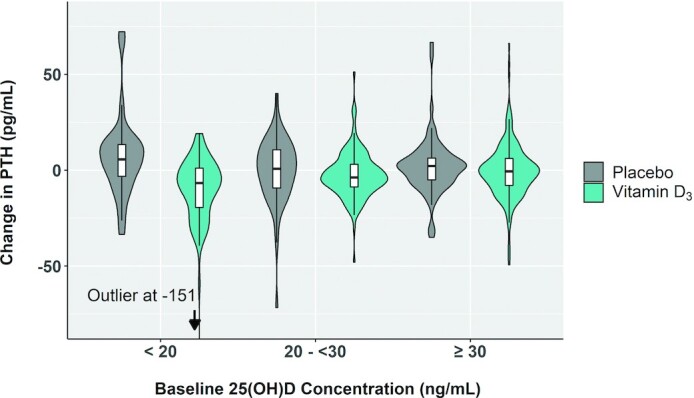
Change in PTH by baseline 25(OH)D. The horizontal line in each white box indicates the median; top and bottom box borders indicate the first and third quartiles, respectively. The vertical whiskers extending from the boxes depict the most extreme observation within 1.5 times the IQR of the nearest quartile. On each side of the white boxes are kernel density estimations that show the distribution shape of the data. Wider sections represent a higher probability that participants of the population (n = 453) will take on the given value; the thinner sections represent a lower probability. PTH, parathyroid hormone; 25(OH)D, 25-hydroxyvitamin D.