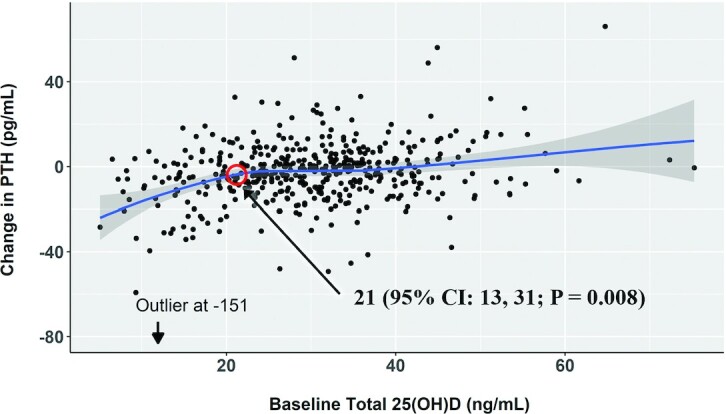
FIGURE 2.

Loess curve showing change in PTH by baseline 25(OH)D among participants assigned to vitamin D3 (n = 453). The shaded area represents the pointwise 95% CI around the values on the fitted Loess curve. The red circle at 21 ng/mL represents the 25(OH)D concentration where a segmented threshold effect was seen using a threshold linear regression model with robust SEs (37). The test for statistical significance is based on a maximum likelihood ratio statistic. PTH, parathyroid hormone; 25(OH)D, 25-hydroxyvitamin D.
