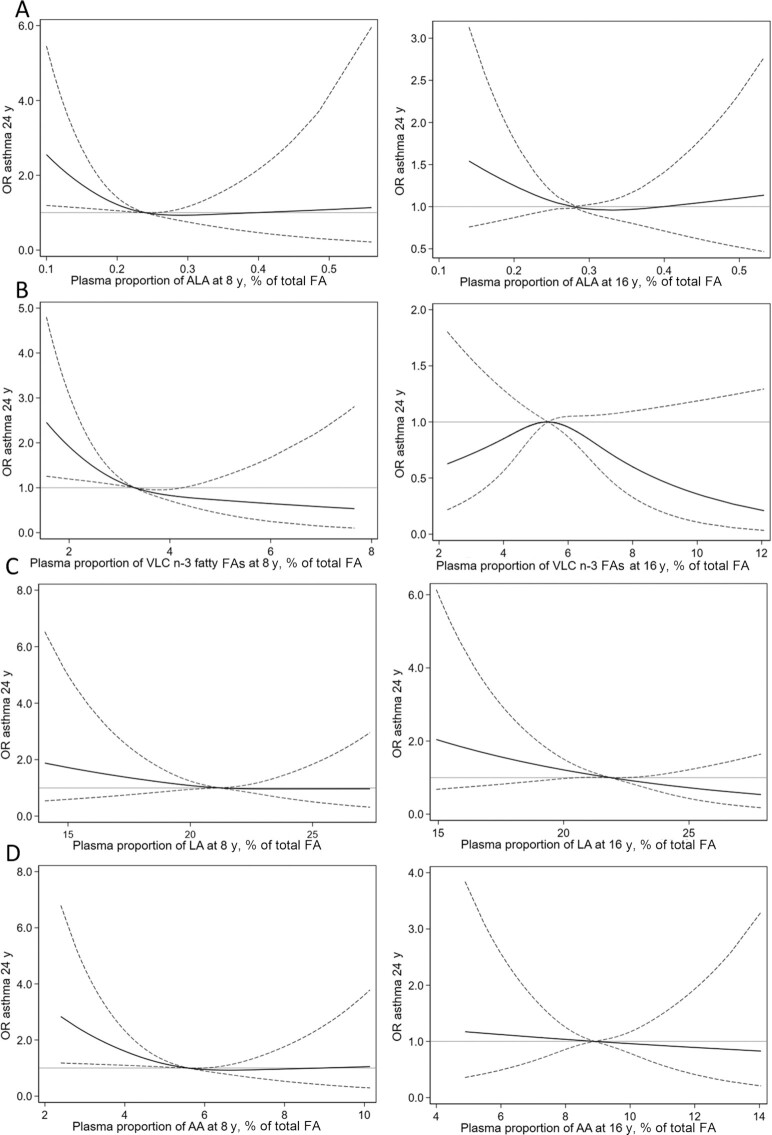
FIGURE 1.
Associations between continuous plasma proportions of ALA (18:3n–3) (A), sum of VLC n–3 PUFAs [EPA (20:5n–3), docosapentaenoic acid (22:5n–3), and DHA (22:6n–3)] (B), LA (18:2n–6) (C), and AA (20:4n–6) (D) and prevalent asthma at 24 y, flexibly modeled using restricted cubic splines with 3 knots (n = 831). The left panel represents PUFA proportions at 8 y and the right panel represents PUFA proportions at 16 y. ORs and 95% CIs were estimated using logistic regression adjusted for sex, allergic heredity, parental occupation at baseline, and maternal smoking in pregnancy and/or infancy, with the median proportions for each PUFA as the reference. The solid lines represent ORs and the dashed lines represent 95% CIs. AA, arachidonic acid; ALA, α-linolenic acid; FA, fatty acid; LA, linoleic acid; VLC, very-long-chain.

