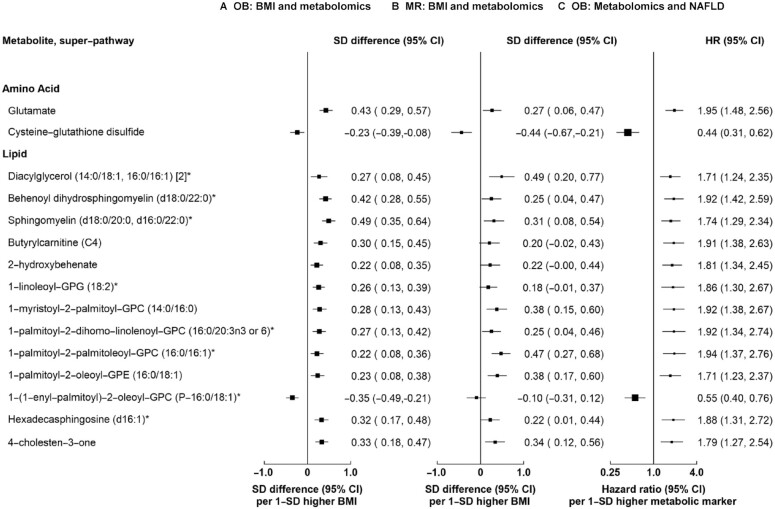
FIGURE 3.
Associations of BMI, metabolomic biomarkers, and risk of NAFLD for 15 metabolomic biomarkers associated with both BMI and NAFLD at 5% FDR. Column A shows adjusted SD differences (95% CI) of metabolomic biomarkers per 1-SD higher observational BMI for 15 metabolomic biomarkers associated with both BMI and NAFLD with FDR-corrected P values <0.05. Column B shows corresponding estimates per 1-SD higher genetically elevated BMI. The observational estimates were adjusted for age, age squared, sex, area, smoking, education, and fasting time. The MR estimates were adjusted for age, age squared, sex, area, the first 12 principal components, education, and smoking. The SD for BMI in the whole CKB cohort was 3.4 kg/m2. Column C shows adjusted HR (95% CI) of NAFLD per 1-SD higher metabolomic biomarkers. An asterisk denotes that the metabolic biomarker is a mixture of isoforms (with the same number of carbons and carbon-carbon double bonds). FDR, false discovery rate; GPG, glycerophosphoglycerol; GPC, glycerophosphocholine; OB, observational; MR, Mendelian randomization; NAFLD, nonalcoholic fatty liver disease.

