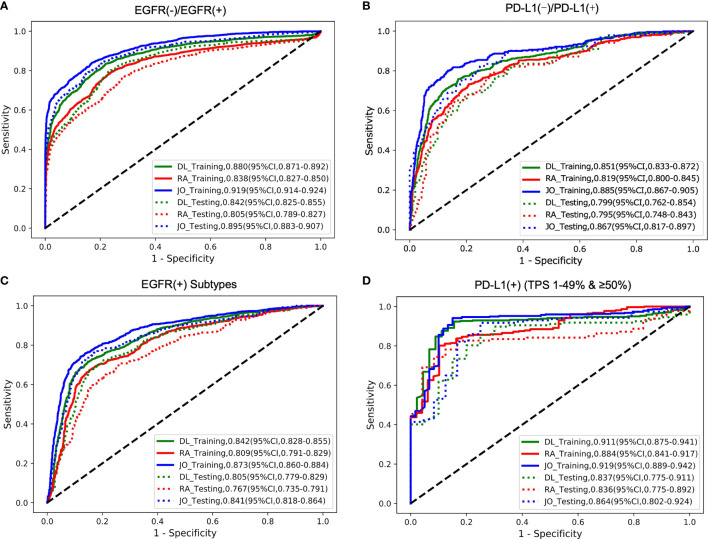
Figure 3.
The model performances in the prediction of two outcomes (EGFR cohort and PD-L1 cohort). The ROC curves for predicting (A) EGFR gene mutation status (mutant or wild); (B) PD-L1 status (positive or negative); (C) EGFR gene subtype mutations (19Del; L858R or Other); (D) PD-L1expression status (PD-L1 TPS 1%–49% or ≥50%). DL indicated that our image-based DL system used local tumor volume and global CT volume. RA indicated that our image-based radiomics model and the JO indicated that the joint model combined with the DL feature, radiomics feature, and clinical features. The solid line represents the performances on the training set, and the dotted line represents the effect on the test set.

