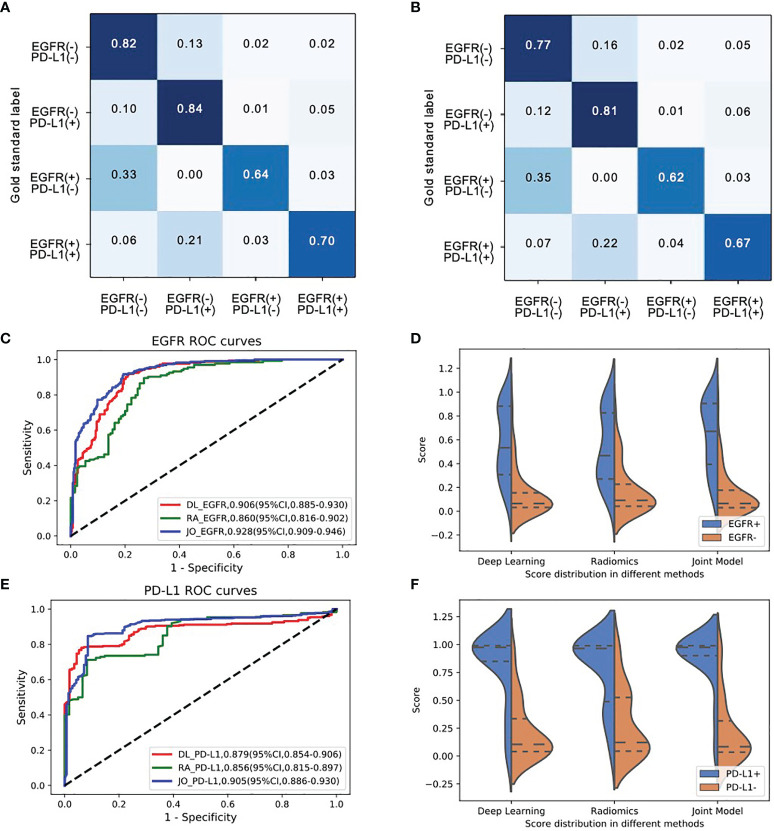
Figure 4.
The model performances in the prediction of joint-mutant genes (EGFR and PD-L1 cohort). Confusion matrix of (A) training set and (B) testing set indicated most errors occurred in the adjacent groups. (C) The ROC curves and (D) three model scores predicting EGFR mutation; (E) the ROC curves and (F) three model scores predicting PD-L1 expression status.

