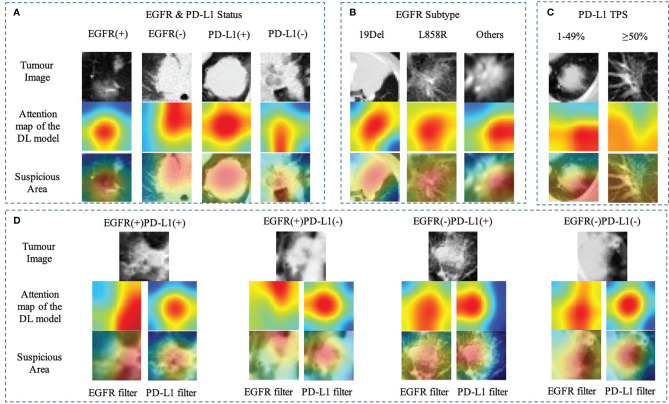
Figure 5.
Heatmap of characteristics that contributed to the prediction of gene mutation (A) EGFR and PD-L1 status; (B) EGFR subtype (19Del, L858R, or other); (C) PD-L1expression status (PD-L1 TPS, 1%–49% or ≥50%); (D) EGFR mutation combined with PD-L1 status using different filters. The first row showed the origin tumor image in the 3D volume; the second and third rows visualize the attention regions of a network for distinct mutant categories.

