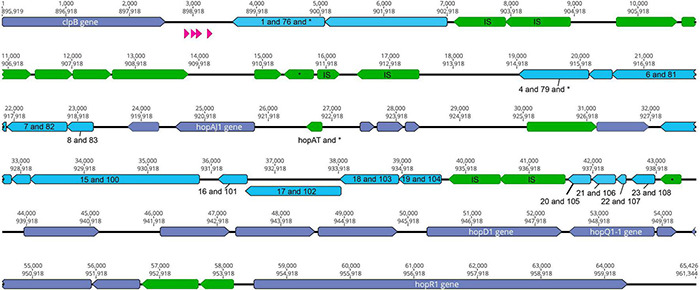
FIGURE 2.

The clpB-hopR Region in PtoDC3000. Here we visualize the region between clpB and hopR from the PtoDC3000 genome, and compare this region to both predicted ICE elements from PmaES4326. Each predicted locus is colored as purple (present in one of the PmaES4326 ICE elements), blue (present in both PmaES4326 ICE elements as per nucleotide identity), and green (only present in PtoDC3000). Predicted tRNA loci are shown in magenta. We also show two nucleotide positions within this region: top number is from the start of clpB and the bottom number is from the start of the genome (from dnaA). We label all identified type III effector loci and clpB, as well as all annotated IS elements (with an “IS”) and genes that have predicted frameshifts (with an “*”). All genes potentially implicated in ICE function have been labeled with numbers corresponding to potential orthologs from strain PmaES4326 ICEs and listed in Table 3.
