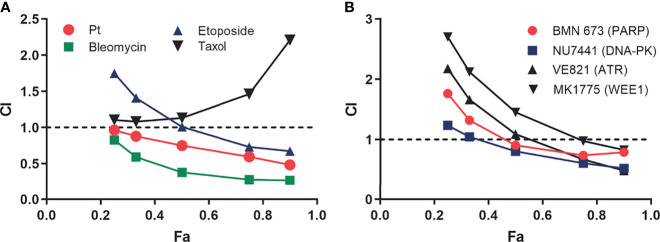
Figure 6.
Analysis of replication protein A inhibitor (RPAi) 329 combination treatment. (A) Chou-Talalay analysis of combination with chemotherapeutics. The combination index (CI) is plotted as a function of the fraction of cell affected (Fa) for each treatment combination of the 329. (B) Chou-Talalay analysis of combination with DDR-targeted agents as described in panel (A).

