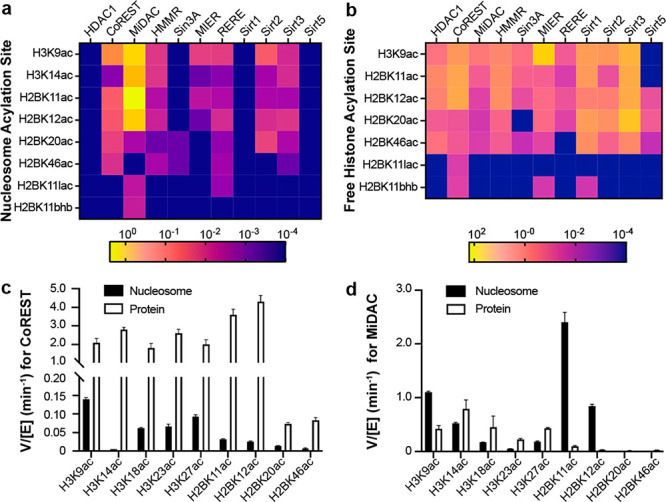
Figure 4.

Heatmap for V/[E] (min–1) of HDAC1 complexes and sirtuins assays with (a) acylated H3 and H2B nucleosomes, (b) acylated free H3 and H2B proteins. Bar graph of V/[E] (min–1) on nucleosome and histone free protein for (c) CoREST, (d) MiDAC. A part of the data for H3K14ac, H3K18ac, H3K23ac, and H3K27ac for both complexes are incorporated from our previous report.32
