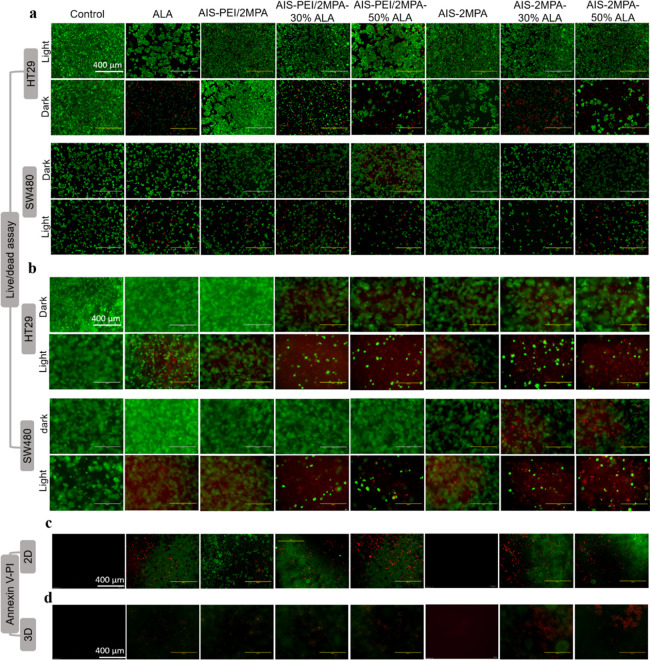
Figure 6.
Live/dead images of HT29 and SW480 (a) 2D and (b) 3D-spheroid cultures. The cultures were treated with free ALA (0.35 mM), AIS-2MPA-3, AIS-2MPA-3-30%ALA, and AIS-2MPA-3-50%ALA QDs at 50 μg/mL and free ALA (0.015 mM), AIS-PEI/2MPA-1, AIS-PEI/2MPA-1-30%ALA, and AIS-PEI/2MPA-1-50%ALA at 2 μg/mL after 24 h incubation with/without PDT illuminated at 420 nm with a blue lamp for 5 min. Apoptotic and necrotic-induced cell death in (c) the 2D and (d) 3D cultures of the SW480 cells. Comparison of the cell death pathways induced after PDT (420 nm with a blue lamp for 5 min) with free ALA (0.35 mM), AIS-2MPA-3, AIS-2MPA-3-30%ALA, and AIS-2MPA-3-50%ALA QDs at 50 μg/mL and free ALA (0.015 mM), AIS-PEI/2MPA-1, AIS-PEI/2MPA-1-30%ALA, and AIS-PEI/2MPA-1-50%ALA at 2 μg/mL. Annexin-V was used to indicate apoptosis (green), and propidium iodide was used to indicate necrosis (red). “Control” indicates the untreated cells. Scale bars for the images are 400 μm.

