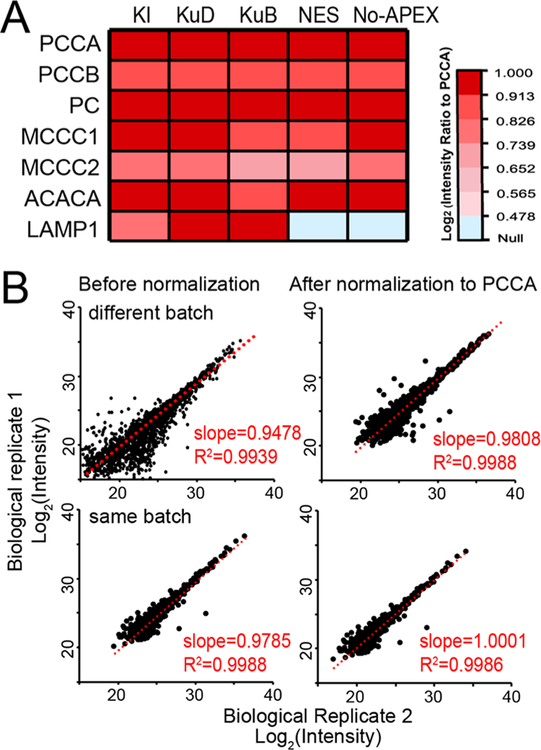
Figure 4.
Normalization of APEX proteomics data to the endogenously biotinylated protein, PCCA. (A) Heatmap intensities of endogenously biotinylated proteins and LAMP1 bait protein across different APEX probes and controls. (B) Intensity scatter plots between biological replicates of KI-LAMP1-APEX data before and after normalization to PCCA for different batches of APEX labeling (upper panel) and the same batch of APEX labeling (lower panel). Slope and R2 of 1 represent perfect reproducibility.

