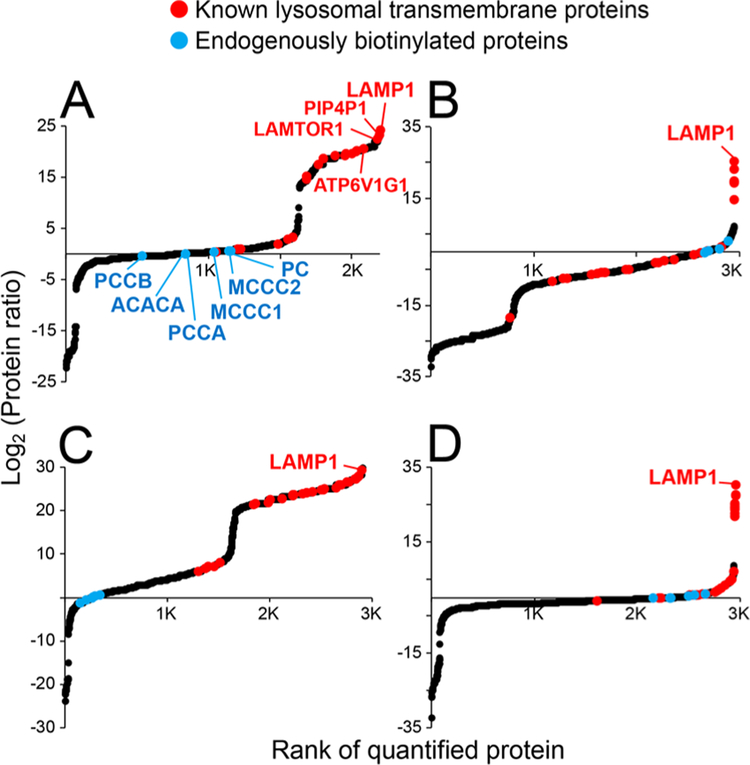
Figure 5.
Evaluation of false discoveries in LAMP1-APEX proteomics using different control datasets. Scatter plots of the rank of protein ratios in (A) KI-LAMP1-APEX proteomics with the No-APEX parental line as control; (B) KI-LAMP1-APEX with NES-APEX as control; (C) KuD-LAMP1-APEX with No-APEX as control; and (D) KuD-LAMP1-APEX with NES-APEX as control. Protein intensities were normalized to endogenously biotinylated protein, PCCA, and averaged among four biological replicates.

