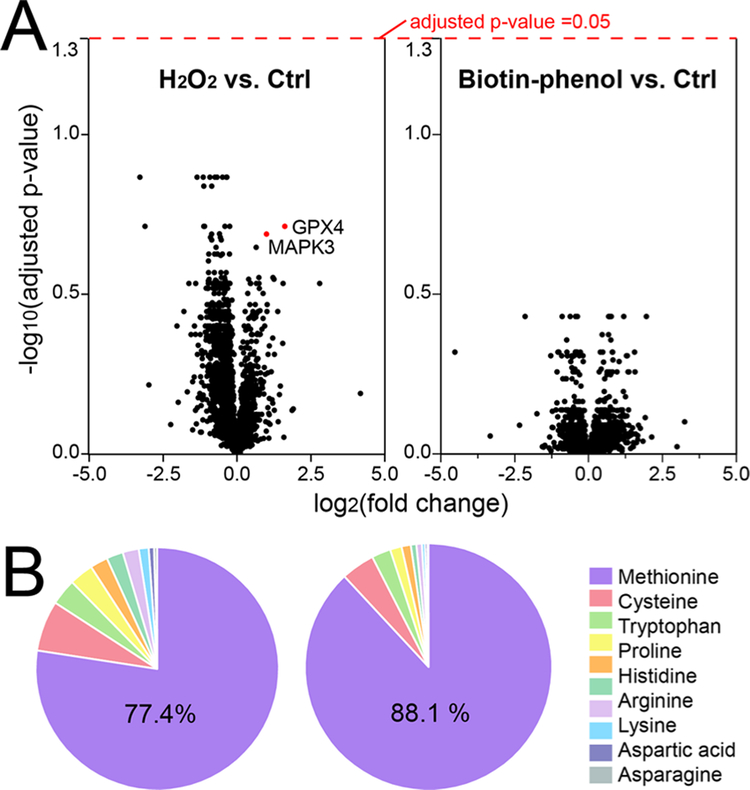
Figure 6.
Evaluation of potential influence of H2O2 and PB treatment to the whole cell proteome. (A) Volcano plots of all of the quantified proteins from H2O2 vs Ctrl and PB vs Ctrl groups in the whole cell protein extract. (B) Pie graph of oxidized amino acid residues from the identified proteins in iPSC-derived neurons.

