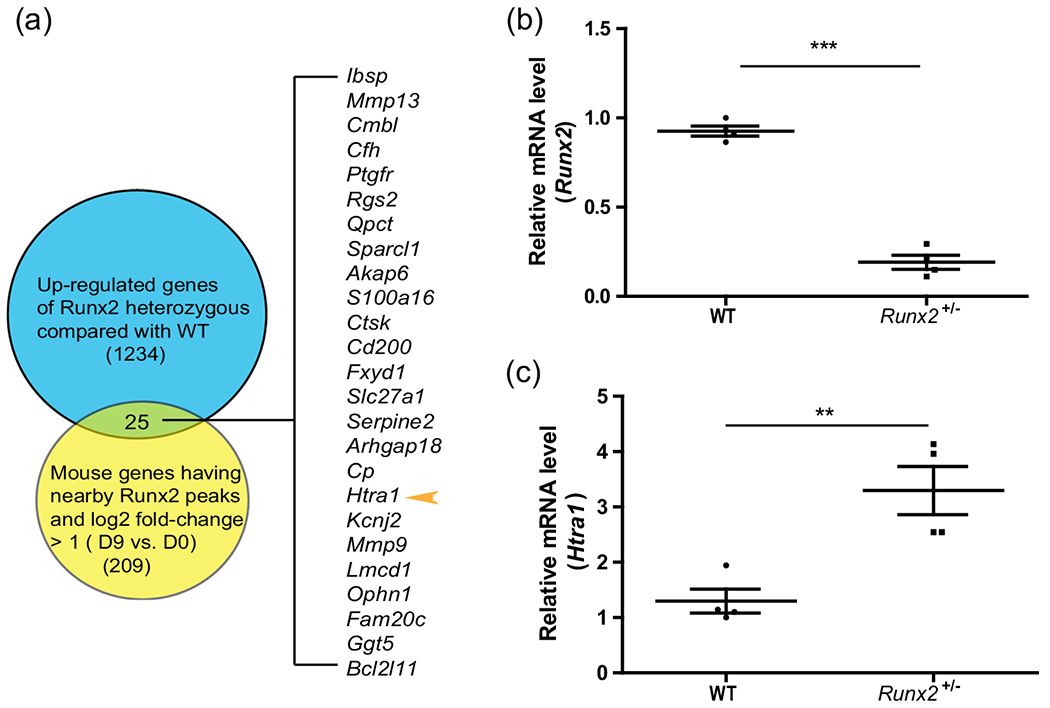
FIGURE 1.

Htra1 was increased in BMSCs isolated from Runx2+/− mutant mice compared with wild-type mice in vivo (a) Venn diagram showing 1,234 upregulated genes from RNA-seq analysis (Runx2+/− mice compared with wild-type mice) (Liu et al., 2016), compared with 209 genes with RUNX2 ChIP-seq peaks nearby (−5 kb and +1 kb relative to the transcriptional start site, log2 fold-change >1, differentiated vs undifferentiated MC3T3-E1 cells) (Wu et al., 2014). (b), (c) qRT-PCR results showing the expression levels of Runx2 and Htra1. All data are presented as means ± SDs. *p < .05, **p < .01, ***p < .0001. qRT-PCR, quantitative reverse transcription polymerase chain reaction; Runx2, Runt-related transcription factor 2; SD, standard deviation
