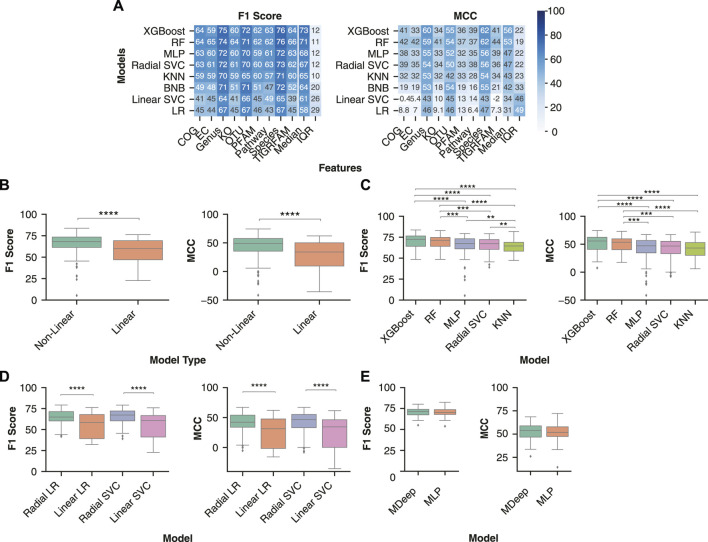
FIGURE 2.
Non-linear models are better suited to identify decision boundaries between control and IBD samples than linear models. (A) Median model performance for each feature set across normalization, transformation, and batch effect correction methods. Rows were sorted in descending order by median performance across all feature sets. (B) Performance distribution of non-linear (RF, MLP, KNN, XGBoost, radial SVC) and linear (BNB, Linear SVC, LR) models. (C) Distribution of classification performance with the non-linear and linear variations of logistic regression and support vector machines across all feature sets. (D) Distribution of IBD classification performance between the non-linear models. The analysis comprised datasets preprocessed using all normalizations and transformations (ILR, CLR, VST, ARS, LOG, TSS, NOT) and batch effect correction (no batch effect correction, zero centering, MMUPHin #1, MMUPHin #2) methods performed on all feature types. (E) Comparison of two neural network architectures: the convolutional neural network MDeep or a MLP. A Mann-Whitney U test with Bonferroni correction was performed to compare all pairwise combinations of models with the significant comparisons indicated. ** indicates p-value < 0.01, *** indicates p-value < 0.001, **** indicates p-value < 0.0001.

